Subscribers to iSPYETF’s free e-mail newsletter receive a market outlook, usually once a week. The market outlook below was sent out on January 25, 2024. If you’d like to sign up for the free e-newsletter, you may do so here (we will never share your e-mail with anyone, just as we don't accept advertising).
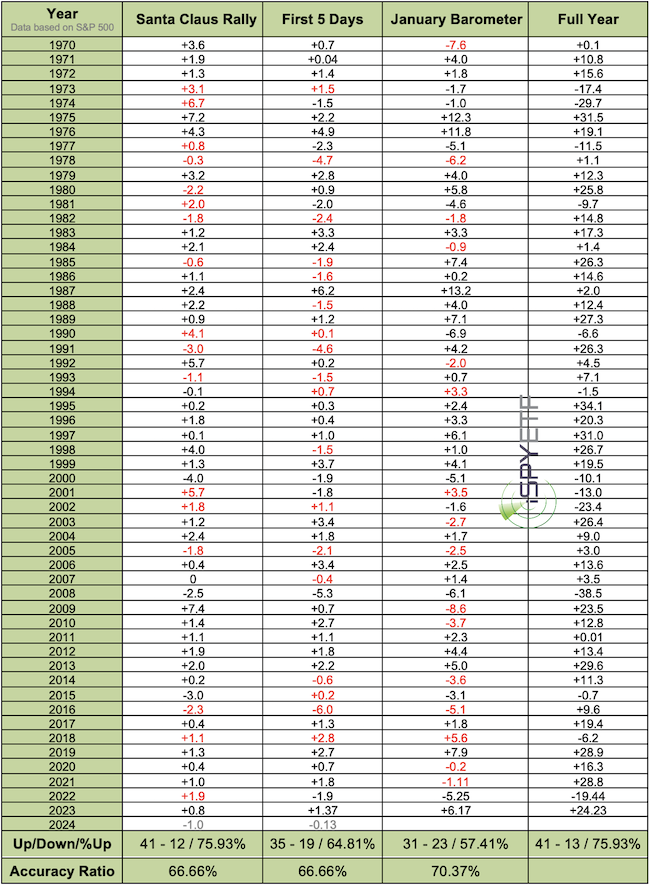
January is an interesting month because it can set the tone for the rest of the year. That's where the term January Barometer (as January goes, so goes the year) comes from. Statistically (going back to 1970), the January Barometer is accurate 70.37% of the time (but, as discussed below, it can be as accurate as 95%).
Another popular barometer is the so-called Santa Claus Rally; "if Santa fails to call, bears may come to Broad and Wall." You've heard it. As a barometer, the Santa Claus Rally is accurate 66.66% of the time.
And, there's one more. The First 5 Days of January. As a barometer, the first 5 days of January are accurate 66.66% of the time.
The individual accuracy ratings have no wow factor, but they can be quite helpful when combined.
For example, last year (2022/2023), all three barometers were positive. That constellation happened 20 times before, 19 times the S&P 500 ended the year with a gain.
That's why the 2023 S&P 500 Forecast (available to subscribers of the Profit Radar Report) stated that: "Based on these barometers, there's a 95% chance the S&P will end 2023 with a + before the final return figure."
This year, the Santa Claus Rally failed to materialize, which sparked a number of bearish media headlines. The first 5 days of January were down too. Should you worry?
The 2024 S&P 500 Forecast pointed out that: "This happened 9 other times. Of those 9 times, the January Barometer joined with a negative reading 6 times. Of those 6 times, the S&P 500 ended the year with losses only twice. The 3 times the January Barometer did not join the negative Santa Claus Rally and First 5 Days of January, the S&P 500 ended the year with gains."
It looks like the January Barometer for 2024 will end up positive, which increases the odds of a positive year for stocks. The odds are not 95% like last year, but still favorable.
The table below shows the 3 barometers along with the full year returns. Returns in red mean that the barometer failed as an indicator for that year.
The barometers are just one of many time-tested indicators covered by the Profit Radar Report's 2024 S&P 500 Forecast. Others include market breadth, technical analysis, Elliott Wave Theory, investor sentiment, seasonality, valuations, money flow, and the fallacy of following the financial media.
Short-term Outlook
Believe it or not, the first few trading days of 2024 actually delivered a discernible Elliott Wave structure for S&P 500 Futures. I published that structure in the January 10, Profit Radar Report (see below).
Thus far, price has followed the projection (and channel) very well, but there is resistance.
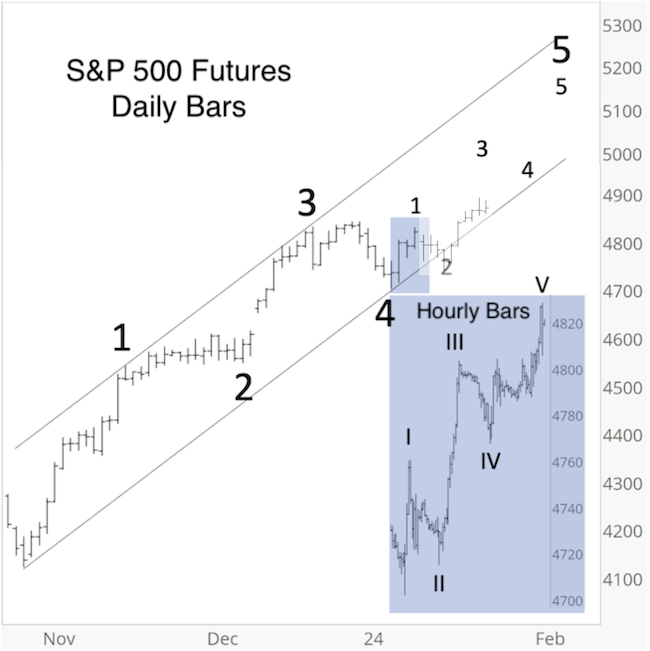
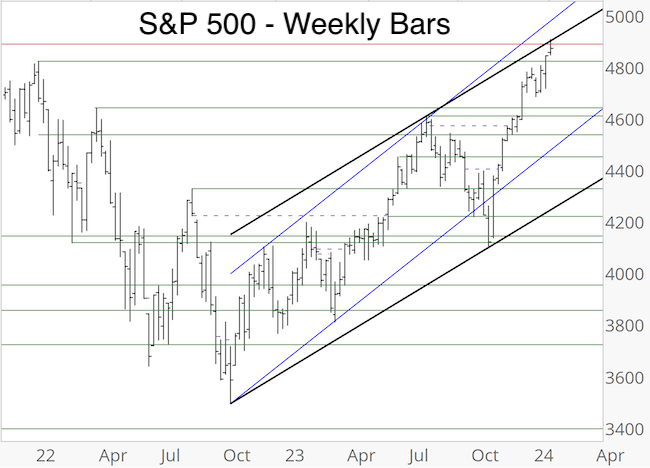
Chart Resistance
Based on the above Elliott Wave pattern, the S&P 500 should move higher, but will have to overcome trend channel and Fibonacci resistance around 4,890 first. While below resistance, there is a measure of risk.
Bitcoin's 'Watershed Moment'
Last week, the SEC approved the first U.S.-listed ETFs to track bitcoin, in what Reuters called a "watershed for the crypto market."
The same day, via the January 10, Profit Radar Report, I published this chart and warning:
"The crypto market had a few watershed events before, but none of them turned out that well for digital currencies or bitcoin. Bitcoin futures are at resistance, RSI-35 is lagging. At least a short-term pullback would make sense here."
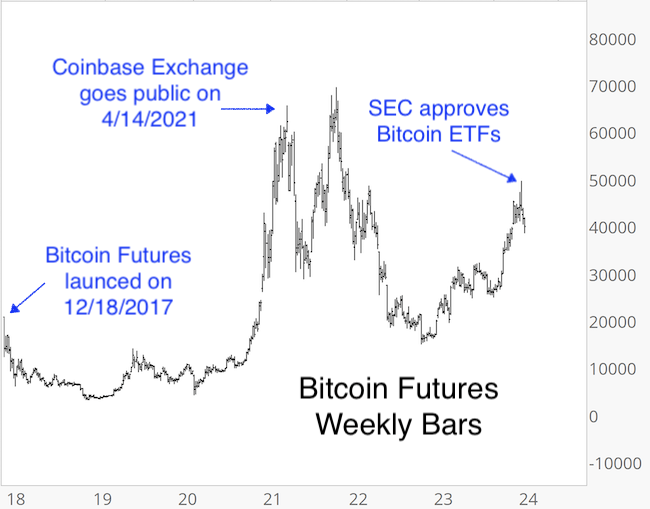
Since its 'watershed high,' bitcoin futures lost as much as 15%. Price is now approaching support, but is also below resistance around 41,000.
As you may have noticed, the Profit Radar Report takes a composite, common sense, data-based approach to investing.
The best way to evaluate the Profit Radar Report is to sign up for a test drive and read the 2024 S&P 500 Forecast.
Before you do that, feel free to read the 2023 S&P 500 Forecast here and compare the forecast with what actually happened. I think you'll be impressed.
Test drive the Profit Radar Report now and become the best-informed investor you know.
The Profit Radar Report comes with a 30-day money back guarantee, but fair warning: 90% of users stay on beyond 30 days.
Barron's rates iSPYETF a "trader with a good track record," and Investor's Business Daily writes "Simon says and the market is playing along."
|
