Subscribers to iSPYETF’s free e-mail newsletter receive a market outlook, usually once a week. The market outlook below was sent out on February 27, 2025. If you’d like to sign up for the free e-newsletter, you may do so here (we will never share your e-mail with anyone, just as we don't accept advertising).
Why does the S&P 500 continuously get whacked around 6,100, but doesn’t stay down?
Here is the one-word answer: Trading range.
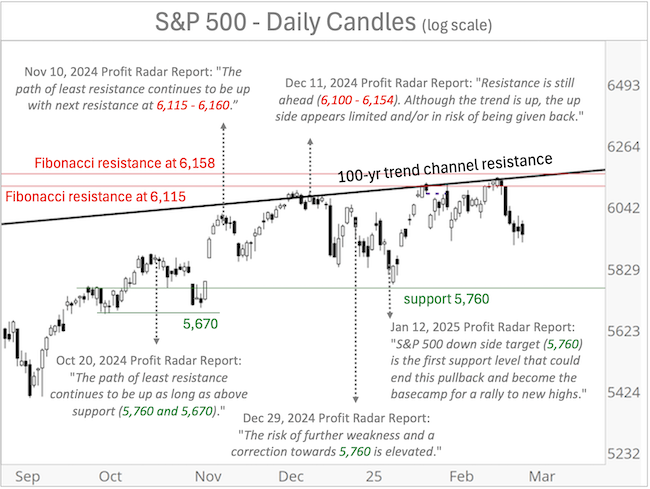
For the past 4 months, the S&P 500 has been stuck between 5,760 - 6,140.
It’s easy to recognize that trading range when looking through the rearview mirror, but the Profit Radar Report outlined the boundaries of this trading range well in advance.

The October 20, 2024 Profit Radar Report stated: “A number of September PRRs mentioned the potential for a FOMO (fear of missing out) rally. The path of least resistance continues to be up as long as above support (5,760 and 5,670).”
The November 10, 2024 Profit Radar Report confirmed the outlook: “The path of least resistance continues to be up with next resistance at 6,115 - 6,160.”
The December 11, 2024 Profit Radar Report started to become a bit more cautious: “Breadth has been getting weaker and resistance is still ahead (6,100 - 6,154). Although the trend is up, the up side appears limited and/or in risk of being given back.”
The December 29, 2024 Profit Radar Report spelled out the down side target: “As long as the S&P stays below 6,050, the risk of further weakness and a correction towards 5,760 is elevated.”
The January 12, 2025 Profit Radar Report outlined that the correction might be over (since support at 5,760 was very close) and stated: “The previously mentioned S&P 500 and Nasdaq-100 down side targets are the first support levels that could end this pullback (they are still 1-2% below Friday’s close) and become the basecamp for a rally to new highs.“
How did we know that the S&P was unlikely to break above 6,160?
It’s actually quite obvious to anyone who spends a few seconds looking at this one 100-year chart.
This chart was featured in the 2025 S&P 500 Forecast and a big reason why we expected a prolonged Q1 trading range.
I also published that chart about a month ago in this article: S&P 500: This 100-year Chart Shows why the S&P 500 is Getting Hit
What’s Next?
Obviously there is no cliffhanger conclusion here. Nothing interesting is going to happen as long as the S&P 500 stays in this trading range (knowing this already a couple months ago likely would have saved you some headache).
It gets interesting when the S&P 500 breaks above or below the range. The big question is:
Will a breakout (or breakdown) stick, or will it just be a fake out?
Continued fact-based, out-of-the box, analysis is available via the Profit Radar Report. Test drive it now and become the best-informed investor you know.
The Profit Radar Report comes with a 30-day money back guarantee, but fair warning: 90% of users stay on beyond 30 days.
Barron's rates iSPYETF a "trader with a good track record," and Investor's Business Daily writes "Simon says and the market is playing along."
|