Subscribers to iSPYETF’s free e-mail newsletter receive a market outlook, usually once a week. The market outlook below was sent out on March 2, 2023. If you’d like to sign up for the free e-newsletter, you may do so here (we will never share your e-mail with anyone, just as we don't accept advertising).
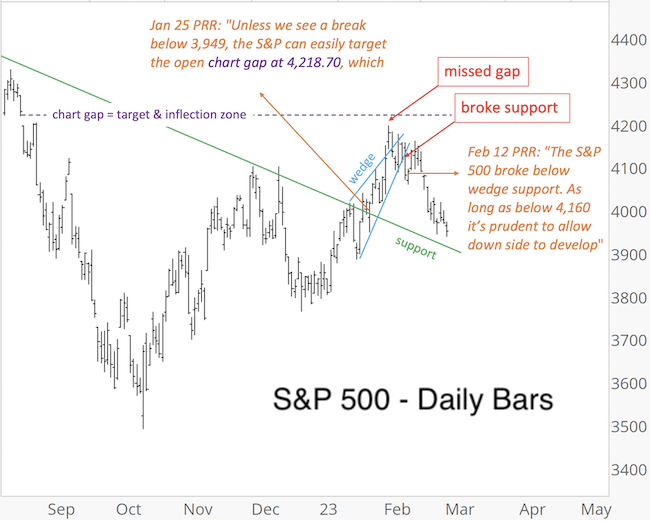
The various indexes are drifting lower 'drip torture style.' For the S&P 500, the drift lower started when it broke below wedge support (in blue). Regular readers remember my warning that we should "let the down side develop" if that wedge breaks.
Honestly, I thought that the S&P 500 would at least close the open chart gap at 4,218.70 before pulling back. But that didn't happen.
The chart below encapsulates the most important chart developments over the past several weeks in one succinct picture (PRR stands for Profit Radar Report).
I know, 'allowing for down side to develop' is a vague forecast. If I knew how much lower the S&P would drop, I'd give a target. But I don't, and I am ok to admit that.
If I put myself into my subscribers' shoes, I prefer an honest forecast over a misleading forecast (I myself am I subscriber to other services and read many misleading outlooks).
Nevertheless, I am fairly certain that any upcoming losses will be erased again. That's based on a number of studies and indicators with outstanding track records.
I'll address some of those in the weeks to come, but here is one for now. The Santa Claus Rally (last 5 days of old and first 2 days of new year), the first 5 days of January, and the month of January all showed positive returns (the table below lists all returns since 1970).
Since 1970, this happened 20 other times. 19 times, the S&P 500 finished the year in positive territory (highlighted in green in table below), once (2018, highlighted in orange) with a loss.
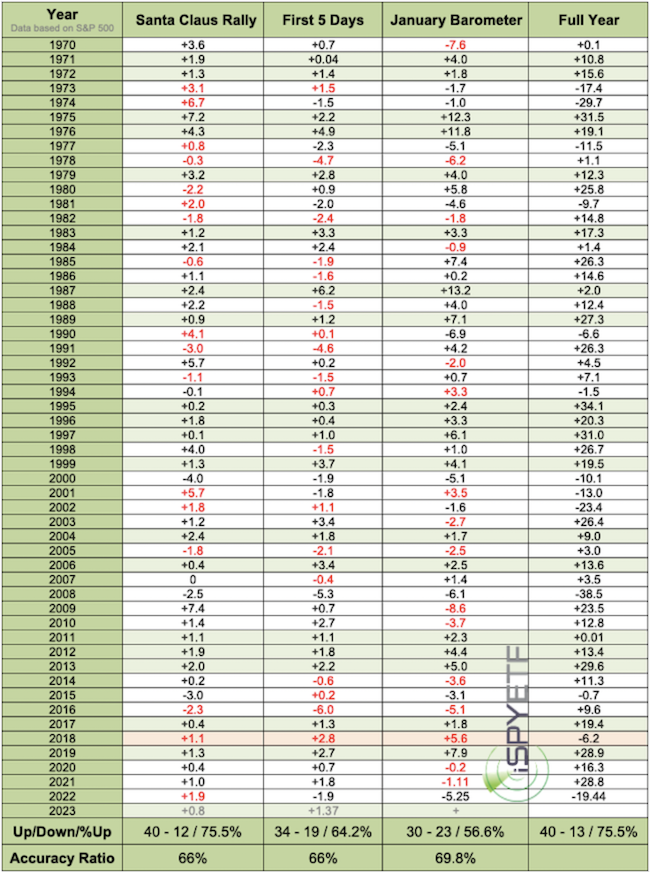
Based on these barometers, there’s a 95% chance the S&P will end 2023 in positive performance territory.
Is this barometer infallible? Certainly not.
Is it better than most of the other (often biased on tunnel vision clouded) analysis out there? I think so.
The above barometer is also in line with the weight of evidence. But, there are also studies with much more bearish outcomes, which leads me to say what nobody wants to hear:
Bullish and bearish indicators may somewhat neutralize each other and cause a prolonged trading range. It's not exciting, it's every investor's worst enemy, but it's certainly a real possibility (and another reason I'm not as bearish as most).
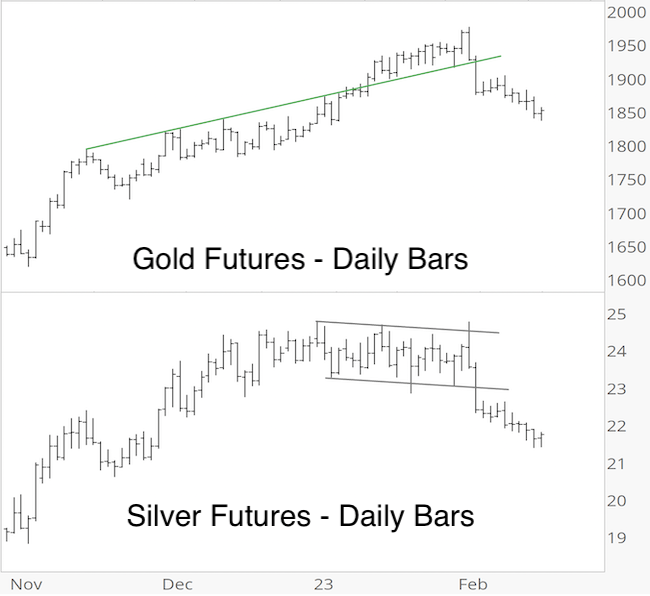
Gold continued its declined until it starting catching a bid again this week. I would still like to see lower prices. An upcoming bounce, however, may test my thesis.
Below, again, is why I suspected gold prices to turn down in late January:
1) There was the bearish divergence between gold and silver.
2) In terms of Elliott Wave pattern, the gold chart allowed for two diametrically opposed interpretations. Despite being total opposites, they had one thing in common. A sizable short-term drop.
I showed the chart below in the January 22, Profit Radar Report and warned that: "both options have a near-term pullback in common."
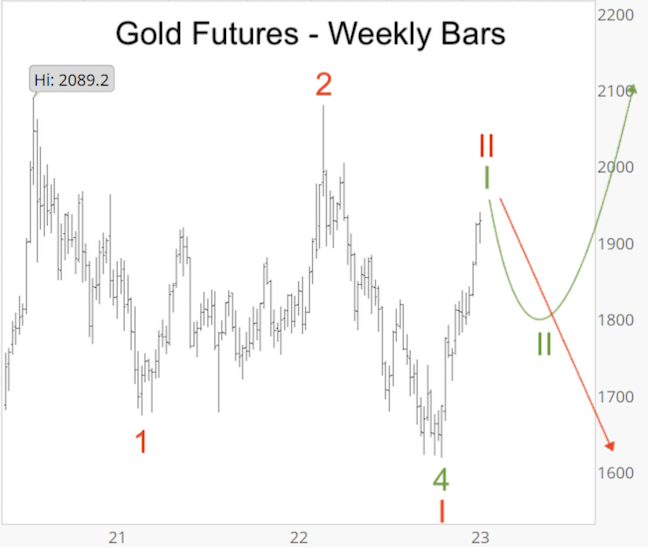
Since then, gold has dropped from 1,975 to 1,810. This may meet the minimum requirement for a wave 2 pullback (green projection).
I personally would like to see still lower prices after this bounce.
Continuous updates for the S&P 500, gold, silver and other assets are available via the Profit Radar Report. You can take a test drive here.
Now is a good time to sign up for the Profit Radar Report, because you will get instant access to the 2023 S&P 500 Forecast.
2023 S&P 500 Forecast
The 2023 S&P 500 is now available! It includes 24 charts and covers the following indicators and topics:
- 2022 Review
- Supply & Demand, Breadth
- Support/Resistance Levels
- Elliott Wave Theory
- Inflation
- Socioeconomic Peace & Prosperity
- Investor Sentiment
- Seasonality & Cycles
- S&P 500 Barometers
- Valuations
- Money Flow
- Risk/Reward Heat Map
- Summary
- 2023 S&P 500 Projection
Some of the discussed indicators come with a 90% and 95% accuracy track record. All indicators and data points are combined into one forward projection (the S&P 500 is tracking it well thus far).
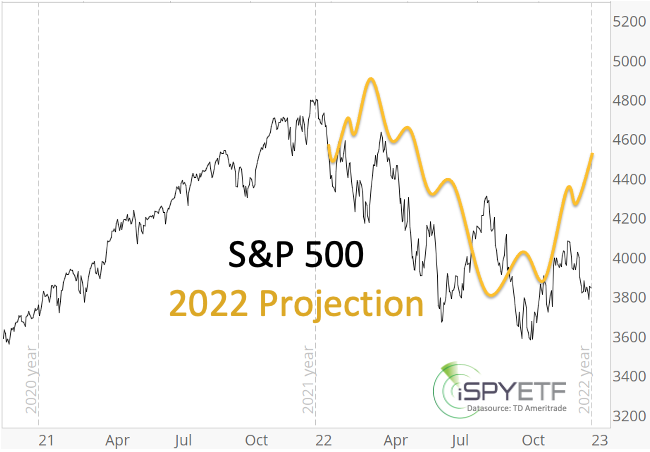
Below is last year's projection compared to the actual S&P 500 performance.
The full 2022 S&P 500 Forecast is available here for your review.
Below are some of the warning signs mentioned in the 2022 S&P 500 Forecast BEFORE the stock market fell into a pothole:
“The bearish divergence (NY Composite a/d lines) reappeared again at the January 2022 S&P 500 highs. This internal market deterioration is a concern and a warning sign.”
“The 6-month average of Titanic signals exceeded 25. It's been a good bear market indicator. Although the majority of breadth studies are positive, this is one that should not be ignored.”
“We’ll focus on the commonality of all 3 (Elliott Wave Theory) scenarios: Up side is limited and down side risk is increasing.”
"Trend line resistance is around 4,915. We do not expect the S&P to break above this trend line in 2022."
“Short-term, the January 10, 2022 low at 4,582 is important. Failure to hold above this level would be a warning signal with the potential for a quick drop into the 4,200 - 4,300 range. If the 4,200 - 4,300 support zone fails, a test of the 4,000 zone (as low as 3,700) is possible.”
“2022 is the mid election year, which is the weakest of the 4-year presidential election year cycle. Historically (going back to 1950), the S&P 500 declines on average about 20% into the mid-term election year low.”
“Since the Fed is planning to unwind and reduce purchases (and shrink its balance sheet) in 2022, the risk of a more serious correction this year is much greater than in 2021.”
To receive the 2023 S&P 500 Forecast and for continued updates and purely fact based research, sign up for the Profit Radar Report and become the best-informed investor you know.
By the way, although the free Market Outlook e-mails arrive in your inbox no more than once every week (or two), Profit Radar Report updates are posted every Wednesday and Sunday afternoon.
Continued updates and factual out-of-the box analysis are available via the Profit Radar Report.
The Profit Radar Report comes with a 30-day money back guarantee, but fair warning: 90% of users stay on beyond 30 days.
Barron's rates iSPYETF a "trader with a good track record," and Investor's Business Daily writes "Simon says and the market is playing along."
|
