'Knowledge is power' is one of my favorite truisms, and I want to empower my subscribers. To do that, I've beefed up the research presented via the Profit Radar Report.
'Beefing up,' to me, means extracting and presenting facts few investors are aware of.
Here are a couple examples of what I mean:
On April 8, the stock market delivered the following trifecta:
- >90% of S&P 500 stocks closed above their 50-day SMA
- >90% of S&P 500 stocks closed above their 200-day SMA
- >7% of NYSE stocks set new 52-week high
This is an amazing feat of strength. The question is: How amazing? And is that good for stocks ... or too good to be true?
The chart below, published in the April 12 Profit Radar Report, identifies when and how often the above conditions existed before.
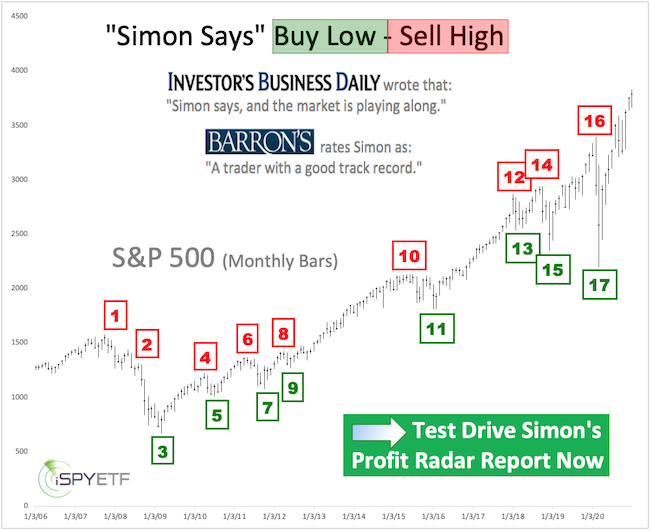
Barron's rates iSPYETF a "trader with a good track record," and Investor's Business Daily writes "Simon says and the market is playing along."
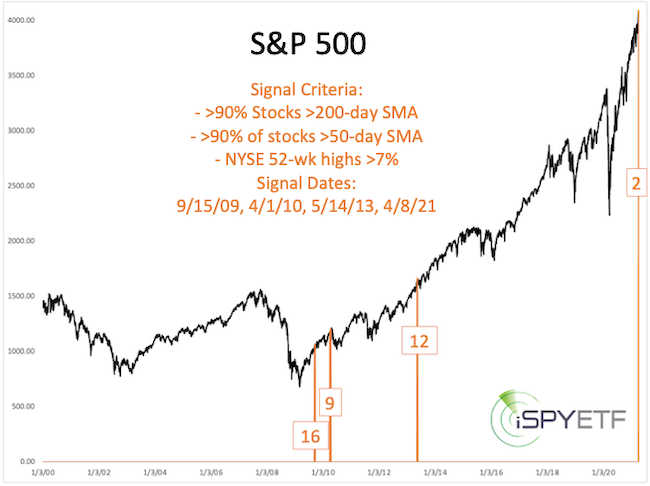
The chart outlines how rare this trifecta is, but it's hard to discern detailed forward performance on a 20-year chart.
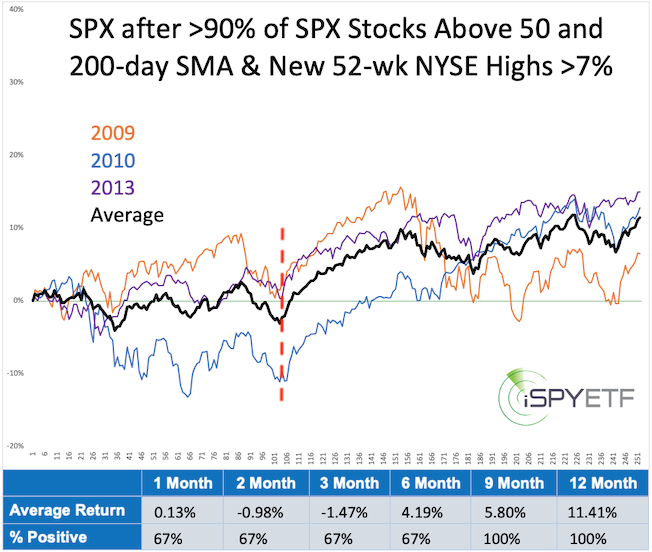
The performance tracker, included in the same update and shown below, graphs S&P 500 forward returns for 1 year after the first signal of each cluster (called the signal date).
The table at the bottom of the chart shows average returns and the percentage of positive returns after 1, 2, 3, 6, 9, 12 months.
A sample size of 4 is not huge, but there are a couple of common themes:
1) Returns for the first few months were rocky
2) Any gains were given back about 5 months later (dashed red line)
But, there is another interesting wrinkle to the 'trifecta feat of strength.' April trading volume has fallen off a cliff.
Are new all-time highs on low volume bearish?
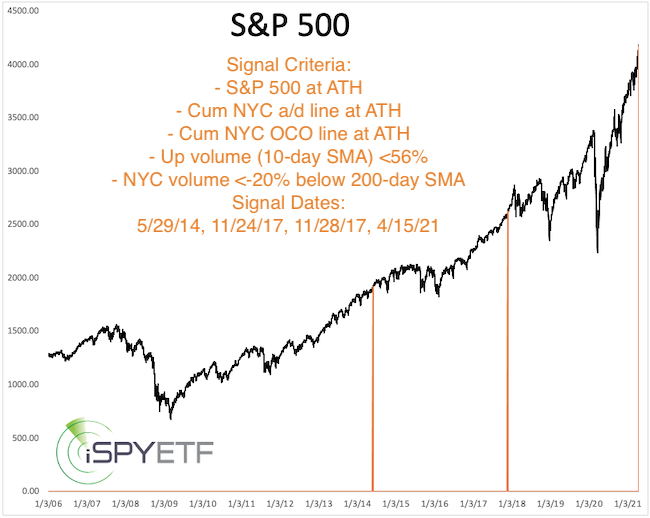
To find out what history says, the April 18 Profit Radar Report identified current markers and searched for historic parallels. Here are last week's markers:
-
S&P 500 at all-time high
-
NY Composite a/d line (cumulative) at all-time high
-
NY Composite OCO a/d line (cumulative) at all-time high
But:
- NYC trading volume more than 20% below its 200-day SMA
- Volume of advancing stocks less than 56%
The orange lines in the chart below highlight when the above conditions existed. Again, we are looking at a rare constellation with one common eventuality: Further gains were possible, but given back at some point over the next few months.
Shown above are only two of dozens of studies conducted every month.
My first step is always to find the common theme conveyed by each individual study. The next step is to find the common theme conveyed by all conducted studies.
The Risk/Reward Heat Map (RRHM) is a simple visual aid that identifies future periods of risk or reward conveyed by hundreds of individual studies.
The RRHM is available for free to subscribers of the Profit Radar Report (you can read more about it here).
No amount of knowledge can consistently predict stock market movements, but a fact-based approach assures that every decision is an educated decision, a decision that tilts the odds in your favor.
The world has never been more uncertain. Get the facts you need to make decisions you can feel good about. Get the Profit Radar Report.
Simon Maierhofer is the founder of iSPYETF and the publisher of the Profit Radar Report. Barron's rated iSPYETF as a "trader with a good track record" (click here for Barron's evaluation of the Profit Radar Report). The Profit Radar Report presents complex market analysis (S&P 500, Dow Jones, gold, silver, euro and bonds) in an easy format. Technical analysis, sentiment indicators, seasonal patterns and common sense are all wrapped up into two or more easy-to-read weekly updates.
|