Question: I read somewhere that you compared US Treasuries to Tesla. Is that true? - Richard - Chicago, IL
Answer: Yes, I did. To understand why I compared 30-year Treasuries to TSLA, let me share my take on TSLA first.
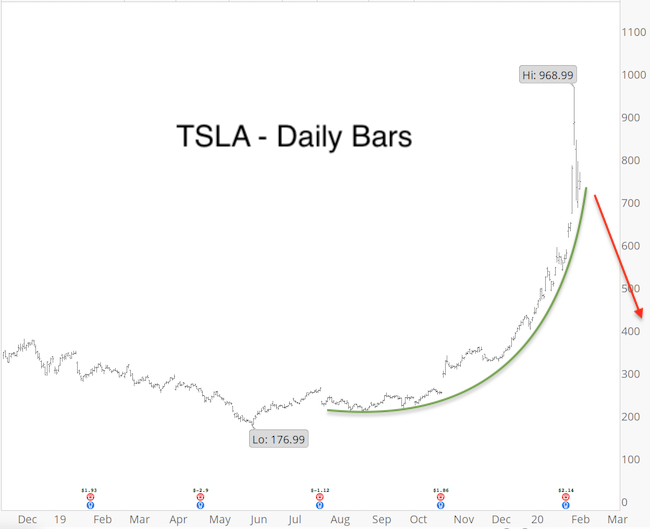
I published the following analysis about TSLA in the February 8 Profit Radar Report:
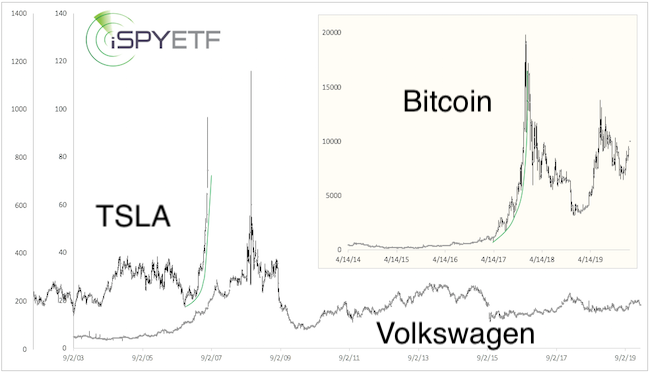
"It’s rare to see a mania big enough to create the ‘support bowl’ line, but TSLA managed to do it. The last big mania with a similar trajectory was bitcoin in November/December 2017. The last one in the automotive industry was VW in October 2008. Ironically, the rally in VW shares (from below 300 to above 1,000 in less then 2 months) was also driven by short sellers, spooked by Porsche taking control of VW. Within a couple months after its spike above 1,000, VW fell back below 100.
The chart below allows for a comparison between TSLA and Volkswagen. Inserted in the upper right is a chart of bitcoin along with its corresponding ‘bowl’ support."
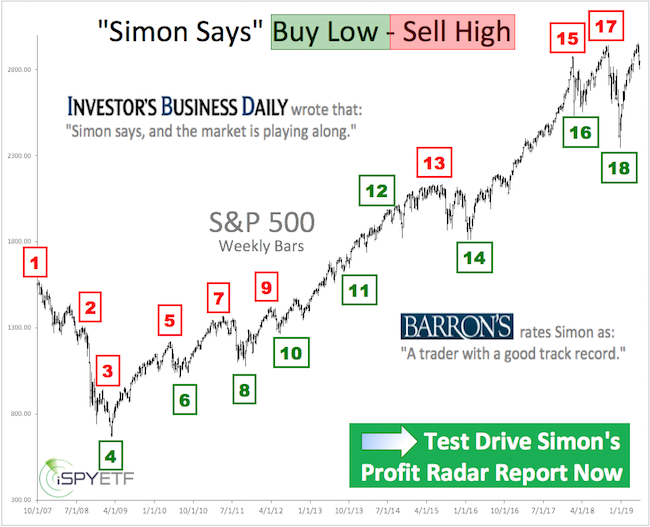
Barron's rates iSPYETF as "trader with a good track record" and Investor's Business Daily says: "When Simon says, the market listens." Find out why Barron's and IBD endorse Simon Maierhofer's Profit Radar Report.
If you enjoy quality, hand-crafted research, >> sign up for the FREE iSPYETF e-newsletter & market outlook
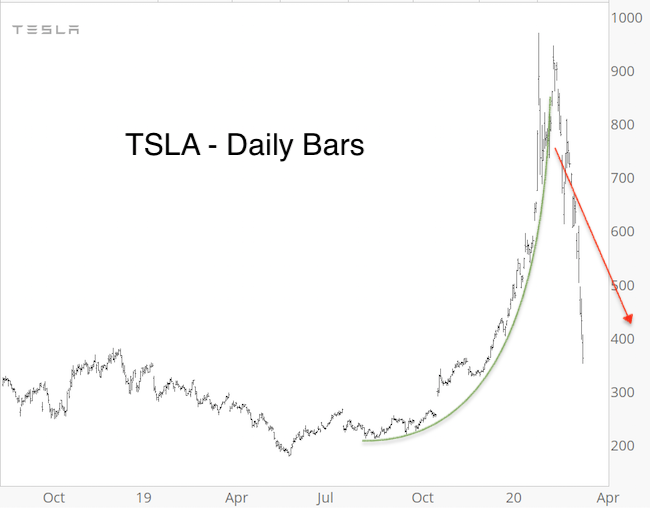
Since then, TSLA fell from 969 to 361.
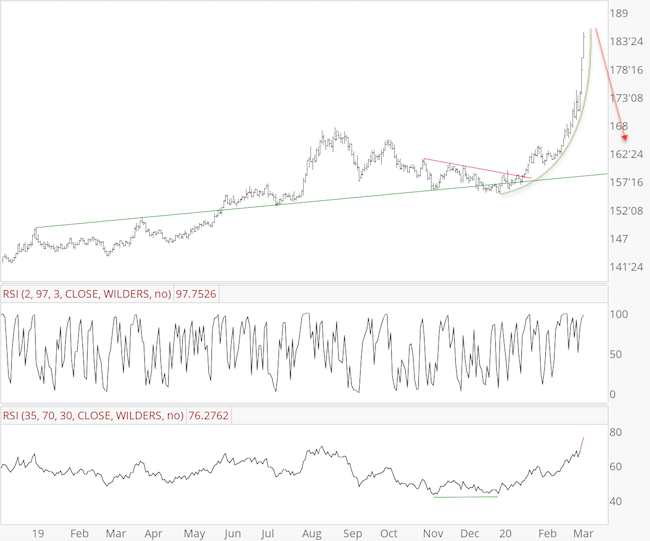
Knowing what happened to TSLA and what led up to TSLA's fall explains why I compared 30-year Treasures und the iShares 20+ year Treasury ETF (TLT) to TSLA. The analysis below is from the March 8, Profit Radar Report:
"30-year Treasury prices spiked more on Friday than the S&P 500 fell, and TLT was up almost twice as much as 30-year Treasury futures. 30-year Treasury futures are up another 2.5% tonight. Appears like a historic flight to safety, and quite likely sign of panic. It’s hard to apply rational analysis to a market that’s acting irrational.
The stock market has shown that what goes up, comes back down, and it can do so very quickly. Odds are the same will happen to Treasuries sooner or later.
In fact, the chart includes curved ‘bowl support,’ the same kind of support/pattern that the showed for TSLA. Down side risk is very high, and aggressive traders may consider adding to shorts."
Below is an updated chart for 30-year Treasury futures:
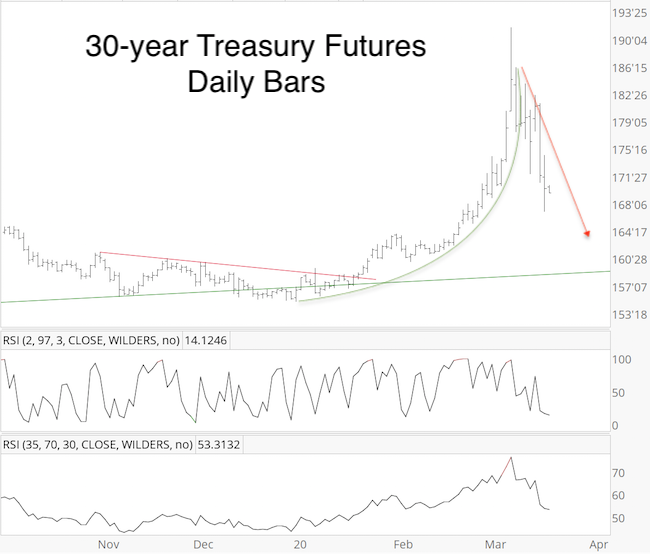
There is a support shelf at 167 - 164, which should cause a bounce, but as long as resistance around 178 holds, the trend is lower.
Continued updates, projections, buy/sell recommendations are available via the Profit Radar Report.
Simon Maierhofer is the founder of iSPYETF and the publisher of the Profit Radar Report. Barron's rated iSPYETF as a "trader with a good track record" (click here for Barron's evaluation of the Profit Radar Report). The Profit Radar Report presents complex market analysis (S&P 500, Dow Jones, gold, silver, euro and bonds) in an easy format. Technical analysis, sentiment indicators, seasonal patterns and common sense are all wrapped up into two or more easy-to-read weekly updates. All Profit Radar Report recommendations resulted in a 59.51% net gain in 2013, 17.59% in 2014, 24.52% in 2015, 52.26% in 2016, and 23.39% in 2017.
|