Here is a look at the 5 (in my humble opinion) most intriguing and important charts right now. As you will notice, not all charts point in the same direction. Nevertheless, I will conclude with a weight of evidence-based conclusion.
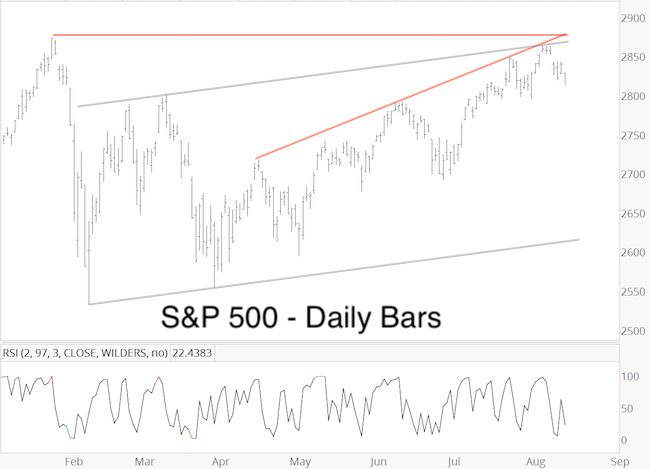
1) S&P 500 Tug of War
The July 15 Profit Radar Report introduced subscribers to a massively bullish S&P 500 chart pattern with an up side target of 3,000+.
Barron's rates iSPYETF as "trader with a good track record" and Investor's Business Daily says: "When Simon says, the market listens." Find out why Barron's and IBD endorse Simon Maierhofer's Profit Radar Report.
The chart insert shows price since July 15. Thus far, triangle support around 2,800 continues to hold. The bullish pattern has not been invalidated, but also not confirmed.
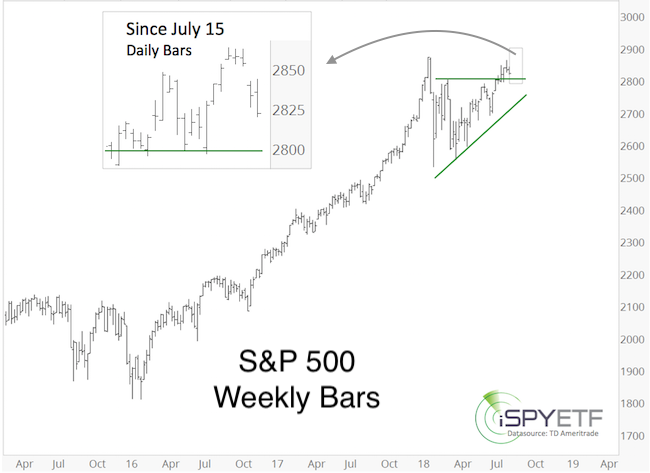
Short-term, as brought out by the August 8 Profit Radar Report, sellers had a window of opportunity due to triple resistance around 2,860 - 2,870.
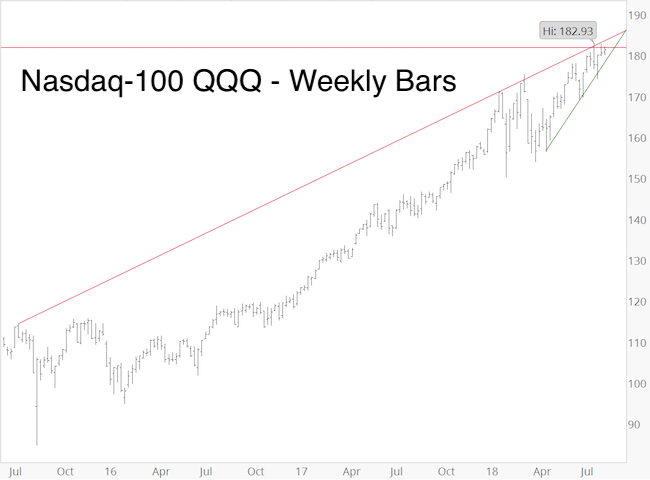
2) Nasdaq Resistance
The Nasdaq-100 QQQ is up against double resistance comprised of the red trend line and a Fibonacci projection level going back to its 2002 low. As long as resistance holds, bears have a window of opportunity to take QQQ lower.
3) Bear’s Best Friend
All major indexes (S&P 500, Dow Jones, Nasdaq, Russell 2000) have been dancing to the beat of their own drum.
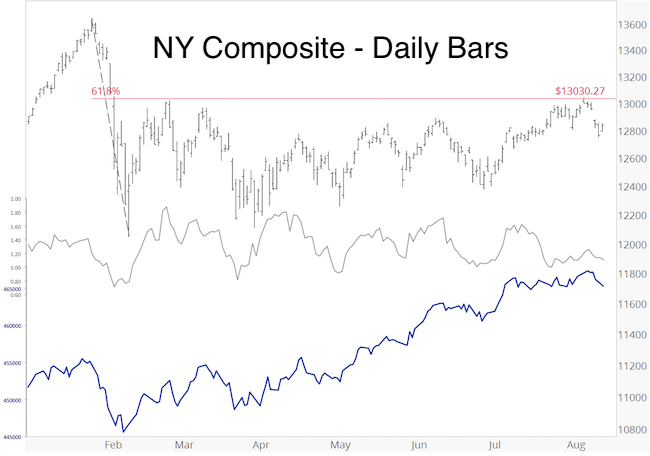
For a broader assessment of US stock’s health, some look at the NY Composite (NYC), which includes some 2000 stocks.
The NYC thus far only retraced 61.8% of the decline from the January high. 61.8 is a Fibonacci number, in fact, it is the ideal retracement of a counter trend rally, a dead cat bounce. That’s what makes the NYC “bear’s best friend” right now.
A look under the hood however, reveals two important facts:
-
More stocks have been advancing than declining (blue graph)
-
The ratio of advancing stocks has slowed significantly (gray graph)
Based on the NYC advance/decline line and ratio, the most likely outcome is short-term weakness followed by longer-term strength.
If you enjoy quality, hand-crafted research, >> Sign up for the FREE iSPYETF Newsletter
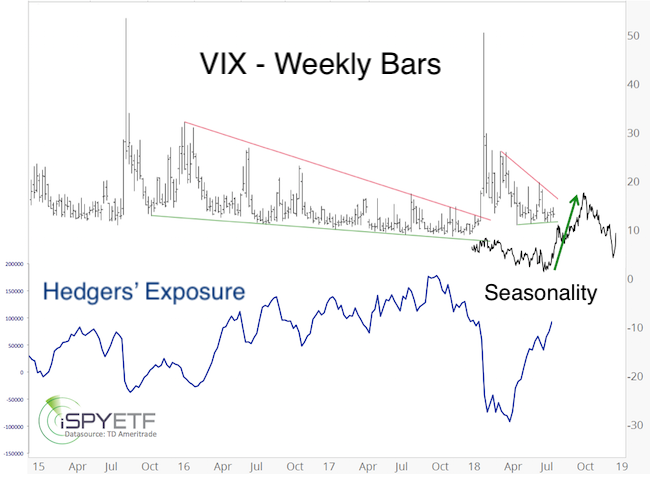
4) VIX
The August 1 Profit Radar Report published the chart below, which plots the VIX against hedgers’ (smart money) exposure and seasonality. Based on those factors, a spike to 17 (red trend line) seemed likely.
This week, the VIX spiked from 10.17 to 15.02, a 47% move. Higher readings are still possible.
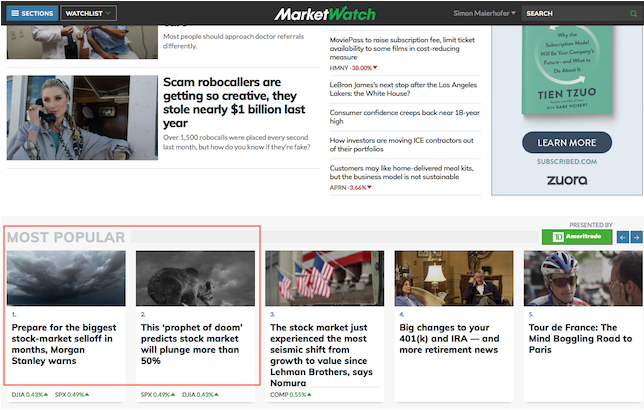
5) Doom-and-Gloom Hurray
Investors loved doom-and-gloom stories a couple of weeks ago. I took a screenshot of most popular MarketWatch articles on July 31. The top two were:
-
Prepare for the biggest stock-market selloff in months, Morgan Stanley warns
-
This ‘prophet of doom’ predicts stock market will plunge more than 50%
Admittedly that’s anecdotal evidence, but heavily bearish investors tend to get burnt first. The early August rally did just that.
Conclusion
If you want to be bullish, there’s plenty of data to support your view.
If you want to be bearish, there’s plenty of data to support your view, too.
Looking at the data objectively, my conclusion (based on the weight of evidence) is that short-term weakness will provide at least one more buying opportunity.
Weakness may not materialize if the S&P 500, Nasdaq, NY Composite move above their respective resistance levels.
Support levels, up side targets and continuous updates are available in the Profit Radar Report.
Barron's rates iSPYETF as "trader with a good track record" and Investor's Business Daily says: "When Simon says, the market listens." Find out why Barron's and IBD endorse Simon Maierhofer's Profit Radar Report.
Simon Maierhofer is the founder of iSPYETF and the publisher of the Profit Radar Report. Barron's rated iSPYETF as a "trader with a good track record" (click here for Barron's profile of the Profit Radar Report). The Profit Radar Report presents complex market analysis (S&P 500, Dow Jones, gold, silver, euro and bonds) in an easy format. Technical analysis, sentiment indicators, seasonal patterns and common sense are all wrapped up into two or more easy-to-read weekly updates. All Profit Radar Report recommendations resulted in a 59.51% net gain in 2013, 17.59% in 2014, 24.52% in 2015, 52.26% in 2016, and 23.39% in 2017.
Follow Simon on Twitter @ iSPYETF or sign up for the FREE iSPYETF Newsletter to get actionable ETF trade ideas delivered for free.
|
