Gold, silver and oil haven’t gone anywhere in 2018. Why?
The chart below plots gold, silver and crude oil against the US Dollar Index.
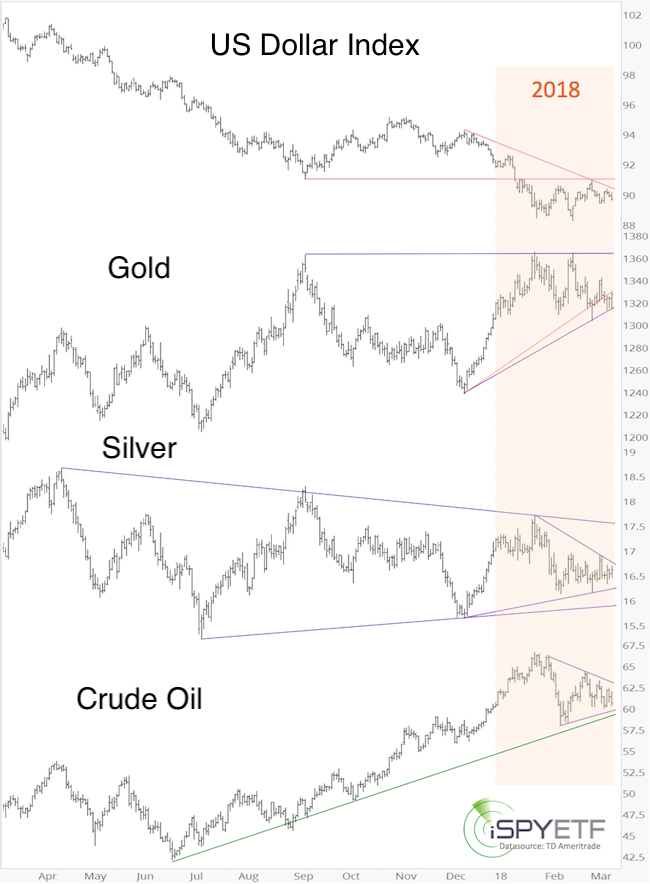
The US dollar has been in a tight trading range for most of 2018. Although asset correlations come and go, commodities are traded in US dollars, and the US dollar inactivity likely contributed to the lack of direction in the commodities market.
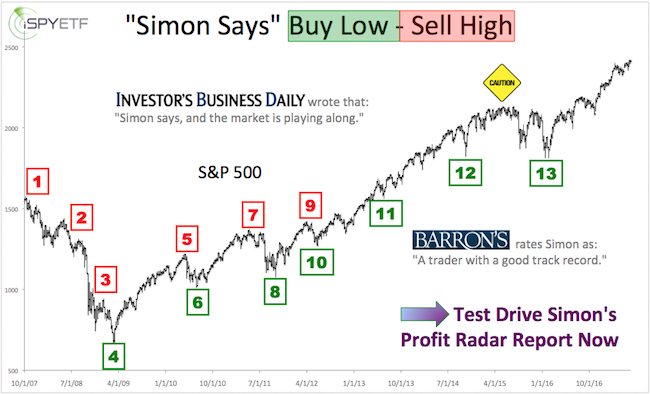
Barron's rates iSPYETF as "trader with a good track record" and Investor's Business Daily says: "When Simon says, the market listens." Find out why Barron's and IBD endorse Simon Maierhofer's Profit Radar Report.
I assume a dollar breakout will awaken commodities.
The November 29 US dollar update featured the chart below, which projects a more significant low in early 2018.
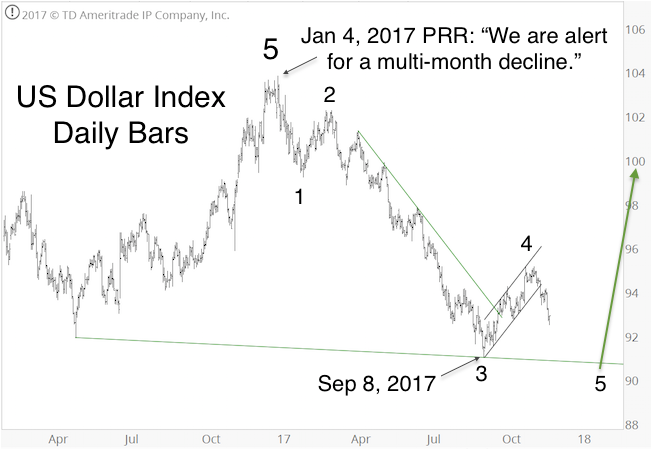
The US dollar is right in the down side target range, but the process of carving out a low is taking longer than projected. We are still looking for a significant dollar bottom (perhaps after one more new low).
If the correlation between US dollar (strong dollar = weak commodities) persists, the US dollar should soon begin to put pressure on commodity prices.
If you enjoy quality, hand-crafted research, >> Sign up for the FREE iSPYETF Newsletter
The first chart highlights some basic support/resistance levels and patterns to watch:
Gold:
Potential triangle with resistance at 1,365 (Fibonacci resistance at 1,382). Support around 1,310.
Silver:
Two potential triangles. A break of the shorter-term triangle should lead to a test of the longer-term triangle boundaries.
Crude Oil:
The January high could be a significant top. The short-term triangle (if it breaks higher) could cause a re-test of the January top and an excellent opportunity to short crude oil via the United States Oil Fund (USO). A break below triangle support may have 55 (long-term trend channel support) as next target.
We will look at technicals, seasonality and sentiment to assess the direction and scope of the next move. Continuous updates will be available via the Profit Radar Report.
Simon Maierhofer is the founder of iSPYETF and the publisher of the Profit Radar Report. Barron's rated iSPYETF as a "trader with a good track record" (click here for Barron's profile of the Profit Radar Report). The Profit Radar Report presents complex market analysis (S&P 500, Dow Jones, gold, silver, euro and bonds) in an easy format. Technical analysis, sentiment indicators, seasonal patterns and common sense are all wrapped up into two or more easy-to-read weekly updates. All Profit Radar Report recommendations resulted in a 59.51% net gain in 2013, 17.59% in 2014, and 24.52% in 2015.
Follow Simon on Twitter @ iSPYETF or sign up for the FREE iSPYETF Newsletter to get actionable ETF trade ideas delivered for free.
If you enjoy quality, hand-crafted research, >> Sign up for the FREE iSPYETF Newsletter
|
