Subscribers to iSPYETF’s free e-mail newsletter receive a market outlook, usually once a week. The market outlook below was sent out on November 11, 2023. If you’d like to sign up for the free e-newsletter, you may do so here (we will never share your e-mail with anyone, just as we don't accept advertising).
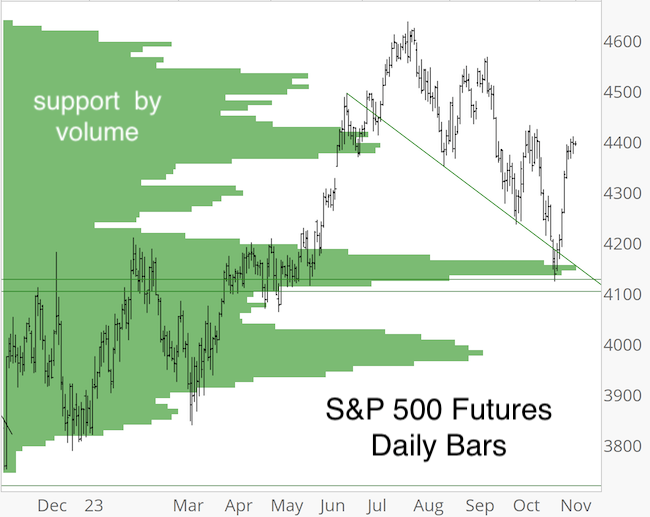
The last free Market Outlook was entitled “S&P 500 - Make or Break” for a reason.
S&P 500 Futures had reached last ditch support. This support was not commonly known (after all, who's heard of 'support by volume'), which made it more valuable for us.
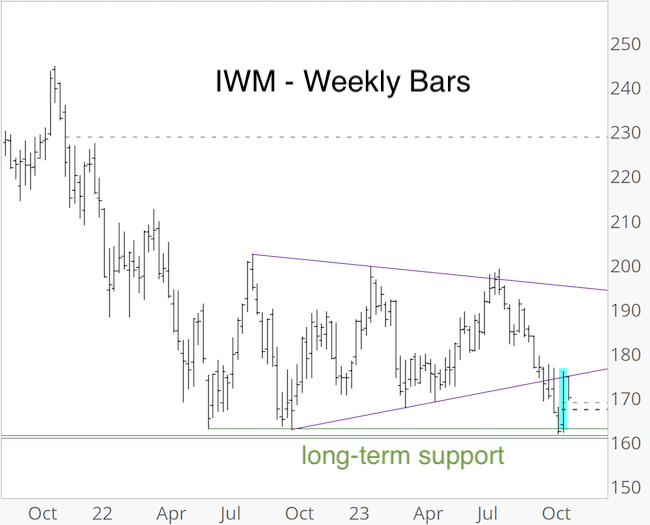
Small cap stocks, represented by IWM, also reached important long-term support. The updated charts below show how price reacted to support.
You probably read about the breadth thrusts triggered by last week’s surge. There are different kind of breadth thrusts. Some follow a strict set of criteria, others can be considered thrusts simply because their magnitude of force makes them rare enough to set its own standard.
For example, via the May 30, 2022, Profit Radar Report, I highlighted a breadth thrust strong enough to set its own standard. Here is what I observed:
“On Wednesday, Thursday, Friday, 78.57%, 82.80%, 85.94% of NYSE-traded stocks advanced on 82.49%, 86.14%, 86% of volume (3-day SMA of 82.44% advancers and 84.88% up volume).”
There were only 10 other thrusts with equal or higher force. However, more important than pointing out when a breadth thrust occurs is knowing how stocks reacted to similar conditions (or signals) in the past.
Here is how I illustrate stock’s reaction to a signal.
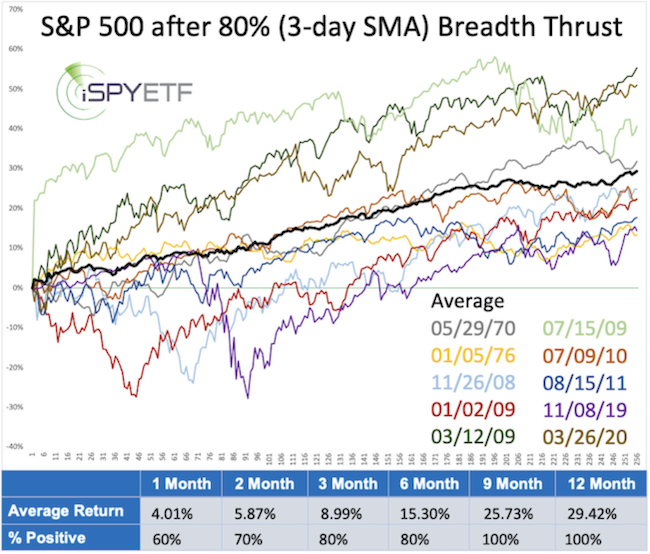
The various colored graphs (published in the May 30, 2022 Profit Radar Report) show S&P 500 forward performance after each prior signal.
The performance tracker, at the bottom of the image, shows:
- The S&P’s average return for 1, 2, 3, 6, 9, 12 months after the signal was given
- The percentage of time the S&P 500 showed a positive return 1, 2, 3, 6, 9, 12 months after the signal.
The actual S&P 500 performance - from May 27, 2022 to May 27, 2023 - was in line with what could be expected. The S&P 500 fell 13.98% into the October 2022 low (similar to the 2008, 2009, 2019 signals) before rallying back for a 1.14% gain 12 months later.
I mention the above breadth thrust because it was the last breadth surge that legitimately could be considered a breadth thrust. There haven’t been any since … until last week.
One of last week's thrusts, the Zweig Breadth Thrust, is probably the most respected breadth signal. Why? Because stocks have to follow a strictly defined set of criteria to trigger a valid signal.
Signals are not very common, but common enough to provide a large enough sample size. There are a total of 11 signals since 1970 (when only counting the first signal in 12 months), the last happened on January 7, 2019.
Wednesday’s Profit Radar Report includes the forward trajectory following each prior signal, along with the performance tracker that shows the average return and odds of gains for the next 1, 2, 3, 6, 9, 12 months.
As far as signals is concerned, this one is as consistent as it gets. While I can’t guarantee future performance based on past history, I guarantee that this is the most data-based approach to investing. And with data-based, I mean making decision based on evidence.
Looking at past S&P 500 trajectories after similar signals, especially for consistent signals like the Zweig Breadth Thrust, also allows us to identify abnormalities that can be an early indication that this - normally reliable signal - is not following the usual path and may fail.
In essence, the benefit of this kind of analysis is two-fold:
- Past history projects the odds of, and magnitude of future returns.
- Failure to adhere to the normal trajectory alerts us early when an otherwise reliable signal may fail.
For continued updates, how the S&P 500 reacted to previous Zweig Breadth Thrust signals, and other purely fact based research, sign up for the Profit Radar Report.
The Profit Radar Report comes with a 30-day money back guarantee, but fair warning: 90% of users stay on beyond 30 days.
Barron's rates iSPYETF a "trader with a good track record," and Investor's Business Daily writes "Simon says and the market is playing along."
|
