Last month, 10-year yield above 3% was all the rage. Since then it has dropped more than 8%.
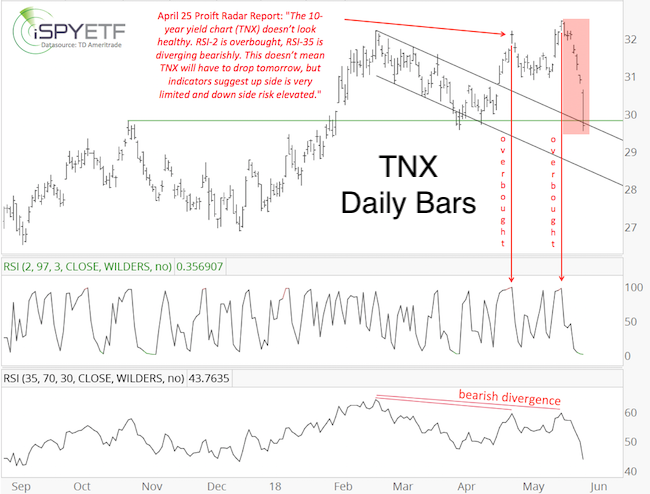
The April 25 Profit Radar Report commented as follows on 10-year yields:
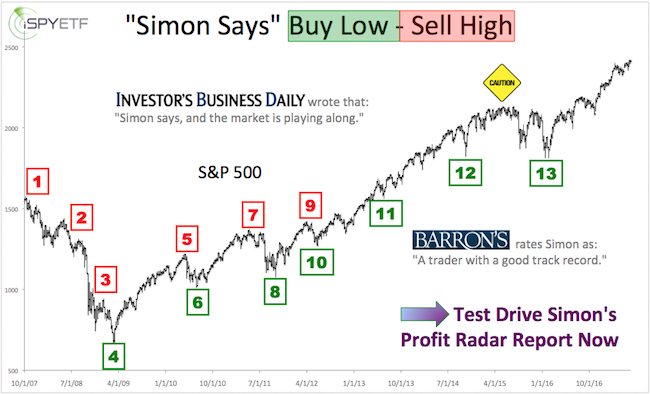
Barron's rates iSPYETF as "trader with a good track record" and Investor's Business Daily says: "When Simon says, the market listens." Find out why Barron's and IBD endorse Simon Maierhofer's Profit Radar Report.
“The topic of 3%+ 10-year Treasury yields has captivated the media, and the media writes what retail investors are interested in. For example:
-
CNBC: Market is obsessed with 10-year yield
-
MarketWatch: Here’s why stock market investors are focused on a 3% 10-year yield
-
CNNMoney: Why everyone is stressing about the 10-year Treasury yield
This kind of fascination is usually reached towards the end of a trend. Commercial hedgers (smart money) are heavily betting on rising 10-year Treasury bond prices (bond prices are inversely correlated to yield, rising bond prices = falling yield).
The 10-year yield chart (TNX) doesn’t look healthy. RSI-2 is overbought, RSI-35 is diverging bearishly. This doesn’t mean TNX will have to drop tomorrow, but indicators suggest up side is very limited and down side risk elevated.”
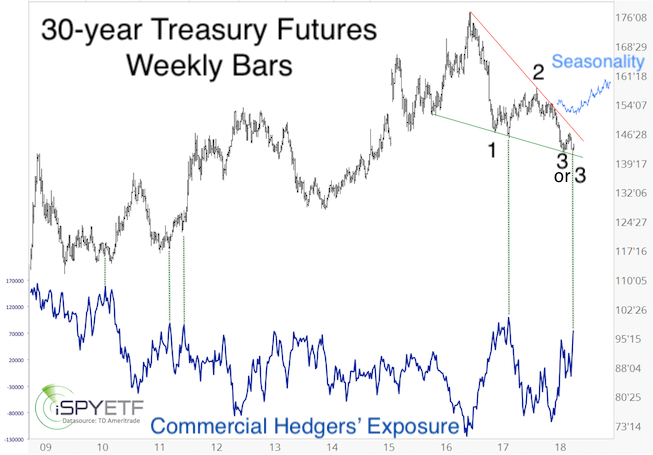
The May 6 Profit Radar Report featured the chart below, which offers a more comprehensive look at 30-year Treasury prices (price and yield move in the opposite direction). Shown are:
-
Investor sentiment (commercial hedgers’ exposure – bottom panel)
-
Seasonality (blue chart insert at top right)
-
Elliott Wave Theory labels
The 3 most important Treasury indicators we watch (technicals, sentiment & seasonality) all suggested higher prices.
If you enjoy quality, hand-crafted research, >> Sign up for the FREE iSPYETF Newsletter
The iShares 20+ year Treasury Bond ETF (TLT) shows how this buy signal played out.
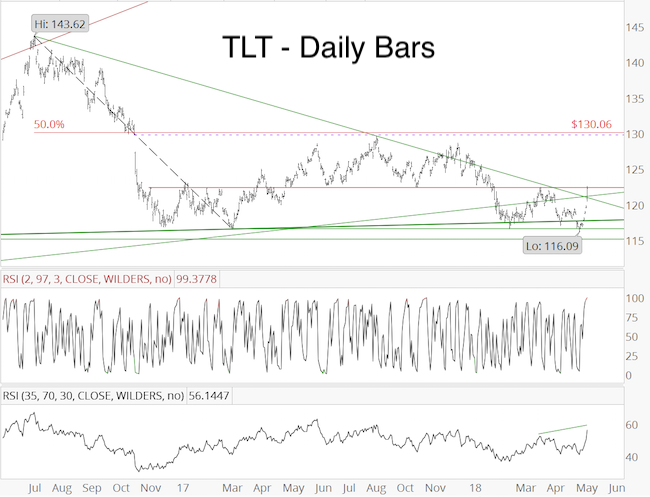
Short-term, TLT is overbought (RSI-2), and susceptible to a pullback. But, RSI-35 confirmed this rally and suggests that any pullback will be followed by more gains.
Continued updates are available via the Profit Radar Report.
Simon Maierhofer is the founder of iSPYETF and the publisher of the Profit Radar Report. Barron's rated iSPYETF as a "trader with a good track record" (click here for Barron's profile of the Profit Radar Report). The Profit Radar Report presents complex market analysis (S&P 500, Dow Jones, gold, silver, euro and bonds) in an easy format. Technical analysis, sentiment indicators, seasonal patterns and common sense are all wrapped up into two or more easy-to-read weekly updates. All Profit Radar Report recommendations resulted in a 59.51% net gain in 2013, 17.59% in 2014, and 24.52% in 2015.
Follow Simon on Twitter @ iSPYETF or sign up for the FREE iSPYETF Newsletter to get actionable ETF trade ideas delivered for free.
If you enjoy quality, hand-crafted research, >> Sign up for the FREE iSPYETF Newsletter
|
