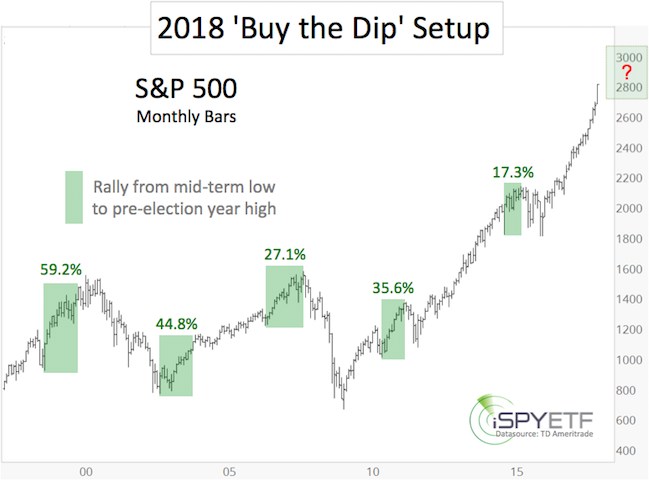
The 2018 S&P 500 Forecast (part of the Profit Radar Report) highlighted this seasonal pattern (and chart):
“2018 is a mid-term year (based on the 4-year presidential election year cycle. Historically, stocks rally from the mid-year (2018) low to the pre-election year (2019) high (on average 50%). The average S&P 500 gain over the last 5 cycles was 36.8% (see chart for individual cycle gains).
Historically (going back to 1950), stocks fall about 20% into the mid-term (2018) low. The average S&P 500 loss from the preceding high to the mid-term low over the last 5 cycles was 18.41%. However, the 2002 loss was unusually large (34.54%). Excluding 2002, the average loss over the last 4 cycles was 14.38%.”
If you enjoy quality, hand-crafted research, >> Sign up for the FREE iSPYETF Newsletter
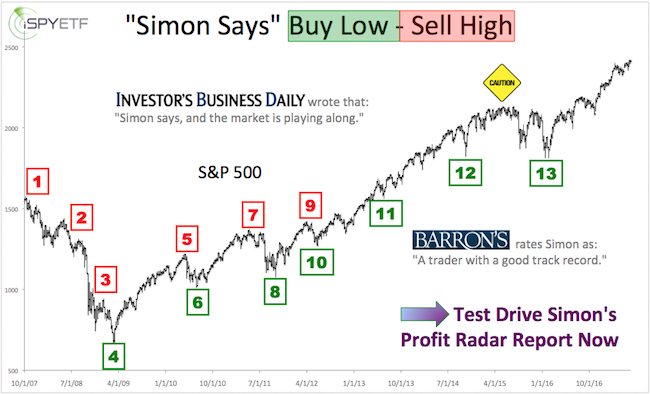
Barron's rates iSPYETF as "trader with a good track record" and Investor's Business Daily says: "When Simon says, the market listens." Find out why Barron's and IBD endorse Simon Maierhofer's Profit Radar Report.
From the January high to the February low, the S&P 500 lost as much as 12.26%.
This is close to the average loss of 14.38% mentioned above.
Based on this seasonal pattern, we should be looking for two developments:
-
A buyable bottom
-
A multi-month rally
Continuous updates will be available via the Profit Radar Report.
Simon Maierhofer is the founder of iSPYETF and the publisher of the Profit Radar Report. Barron's rated iSPYETF as a "trader with a good track record" (click here for Barron's profile of the Profit Radar Report). The Profit Radar Report presents complex market analysis (S&P 500, Dow Jones, gold, silver, euro and bonds) in an easy format. Technical analysis, sentiment indicators, seasonal patterns and common sense are all wrapped up into two or more easy-to-read weekly updates. All Profit Radar Report recommendations resulted in a 59.51% net gain in 2013, 17.59% in 2014, and 24.52% in 2015.
Follow Simon on Twitter @ iSPYETF or sign up for the FREE iSPYETF Newsletter to get actionable ETF trade ideas delivered for free.
If you enjoy quality, hand-crafted research, >> Sign up for the FREE iSPYETF Newsletter
|
