I am about to share the worst trade of my carrier with you. It cost me a fair amount of sleep (and probably cost me a number of subscribers, who must have thought Simon is quite the moron).
Here is the sad tale of a good trade hijacked by an ETF flaw (fortunately there’s a happy ending).
The Setup
Earlier this year, in mid-January, we saw a number of VIX extremes, such as highly elevated SKEW readings (SKEW measures ‘black swan’ risk), near-record SKEW/VIX ratio readings and the highest ever long exposure of commercial VIX traders (smart money). The charts below, published by the Proift Radar Report in January, illustrate the extremes.
Barron's rates iSPYETF as "trader with a good track record" and Investor's Bussines Daily says "When Simon says, the market listens." Find out why Barron's and IBD endorse Simon Maierhofer's Profit Radar Report.
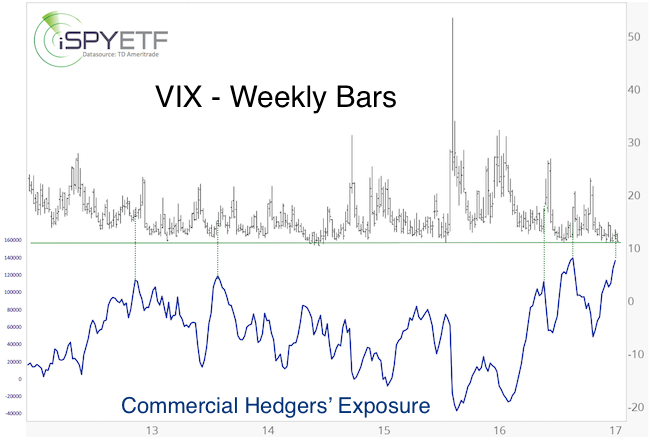
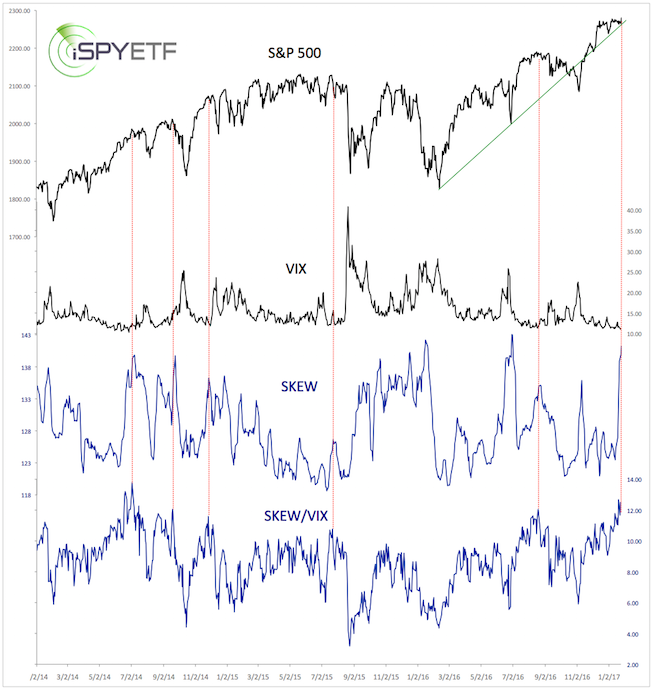
Statistically, those conditions led to an average VIX spike of 22% over the next month every time (even a week later the VIX was higher 85% of the time).
The biggest problem (which we were well aware of) was the lack of a suitable trading vehicle for long VIX exposure. Yes, there is VXX, but it suffers from contango (we have often successfully shorted the VIX via XIV, which puts contango in our favor, more about XIV below).
What is Contango?
Below is a brief explanation of contango (taken from an August 2014 report):
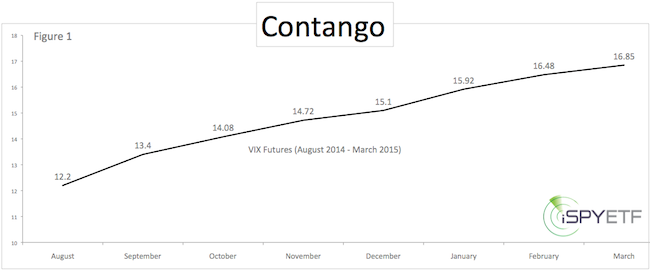
The VIX quoted in-day-to-day life is the CBOE Volatility Index (VIX) spot price (today’s VIX price). However, the futures used to create ETPs like the iPath S&P 500 Short-Term VIX Futures ETN (VXX) are based on the future VIX price, which is almost always more expensive than the spot price. Over time the more expensive VIX futures decline in value, eventually converging with the spot price at expiration.
The chart below compares the current spot price with various futures prices. The difference between the spot price (12.20) and the September futures (13.45) is 9.84%. In other words, it will take a 9.84% move in the VIX to neutralize the time decay between the spot and September futures price.
As time goes by, ETF providers are forced to continuously replace expiring futures with new (more expensive) futures (this process is called ‘rolling over’). The further away the futures expiration date, the bigger the time premium. This time premium and resulting value decay is called contango.
Contango vs the Setup
Despite contango, the VIX buy signal seemed strong enough to deliver a net gain (a 20% short-term VIX spike tends to translate into a 5-7% VXX gain). We were looking for a short-term VIX spike, before a multi-week S&P 500 rally.
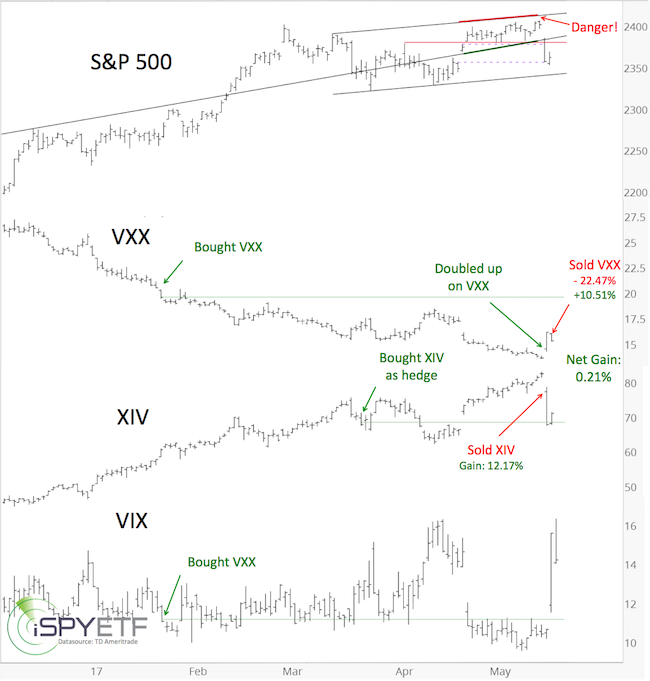
On January 23, we pulled the trigger and bought a very small amount of VXX at 20.60. A week later, the VIX traded higher, and a month later, the VIX traded higher. The VIX even spiked 22% (as expected) a number of times, but VXX contango persistently eroded VXX.
VXX by-passed the short-term VIX spike, and then, as anticipated, the stock market continued higher (which kept the VIX depressed). Nevertheless, we expected a period of choppy trading (volatility) to start in February/March.
If you enjoy quality, hand-crafted research, >> Sign up for the FREE iSPYETF Newsletter
On March 1, the S&P 500 topped, and has basically been range bound since.
On March 23, it was obvious that the VIX would fall again before the next window for a S&P 500 correction arrived. We bought XIV to hedge VXX, which turned out to be a great move.
The Next Window
The window to unwind this unfortunate VIX trade finally arrived this week. The May 14 Profit Radar Report stated that: “We are still looking to sell XIV and double up on VXX at S&P 2,407. Aggressive traders may elect to short the S&P around 2,410.”
Unfortunately there was another blow. The S&P 500 missed our trigger level for XIV and VXX (2,407) by one point (on Tuesday, March 16). The S&P gapped lower the next morning (by 17 points), robbing us of the best opportunity to unwind this trade.
We took the second-best opportunity. The March 17 intraday Profit Radar Report recommended to sell XIV at 77.40, and double up on VXX at 14.45. We closed XIV for a profit of 12.17% and bought VXX at 14.45.
The next morning (Thursday, March 18) we closed our entire VXX trade at 15.97. The VXX portion bought on January 23 accrued a 22.47% loss, the VXX portion bought on May 17 ended with a 10.51% gain. The 11.96% loss was offset by the 12.17% XIV gain.
At the end, we closed this unfortunate trade combo with a tiny 0.21% gain.
Lessons Learned
Patience and impeccable timing (at the end) rescued this trade, but in hindsight, the best worst trade is one not taken.
Contango needs to be respected. In the past, we traded XIV six times (XIV benefits from contango). All six XIV trades were profitable (12.17%, 14.46%, 13.33%, 7.57%, 15.70%, 4.49%). It’s better to focus on XIV (falling VIX) than VXX (rising VIX), especially in a bull market.
Although we knew that the VIX would fall mid-term, we bet on a short-term rise. It’s not smart to bet against the larger trend.
With the VXX trade closed at a miniscule profit, we keep our streak of no losing trade (since June 2015) alive.
The Profit Radar Report provides about 20 specific trade setups per year.
Simon Maierhofer is the founder of iSPYETF and the publisher of the Profit Radar Report. Barron's rated iSPYETF as a "trader with a good track record" (click here for Barron's profile of the Profit Radar Report). The Profit Radar Report presents complex market analysis (S&P 500, Dow Jones, gold, silver, euro and bonds) in an easy format. Technical analysis, sentiment indicators, seasonal patterns and common sense are all wrapped up into two or more easy-to-read weekly updates. All Profit Radar Report recommendations resulted in a 59.51% net gain in 2013, 17.59% in 2014, and 24.52% in 2015.
Follow Simon on Twitter @ iSPYETF or sign up for the FREE iSPYETF Newsletter to get actionable ETF trade ideas delivered for free.

If you enjoy quality, hand-crafted research, >> Sign up for the FREE iSPYETF Newsletter
|
