Subscribers to iSPYETF’s free e-mail newsletter receive a market outlook, usually once a week. The market outlook below was sent out on June 1, 2023. If you’d like to sign up for the free e-newsletter, you may do so here (we will never share your e-mail with anyone, just as we don't accept advertising).
On Tuesday, the S&P 500 deactivated the ‘rally guarantee’ in place for the past 10 months. What provided the rally guarantee?
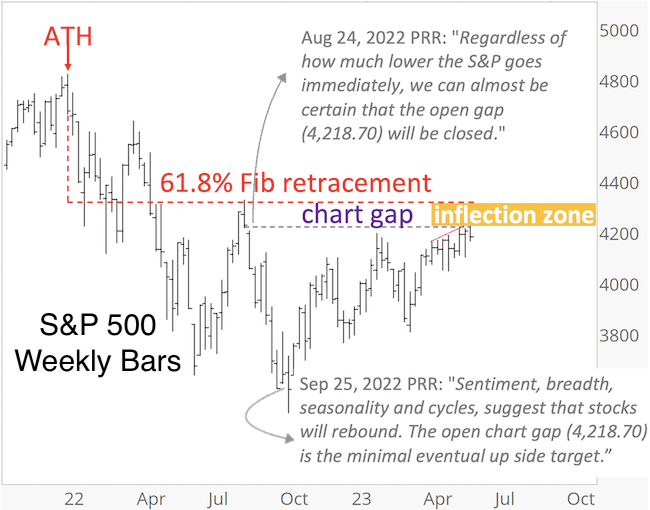
I mentioned the rally guarantee the day after it was created, in the August 24, 2022 Profit Radar Report: “Regardless of how much lower the S&P goes immediately, we can almost be certain that the open gap (4,218.70) will be closed.”
In addition to a rally guarantee, this open chart gap was also our up side target, as highlighted in the September 25, 2022 Profit Radar Report: “Sentiment, breadth, seasonality and cycles, suggest that stocks will rebound once this decline is over. The open chart gap (4,218.70) is the minimal eventual up side target.”
For almost 15 years, chart gaps have been an incredible, little-known, super effective tell that’s seemingly only known to iSPYETF readers.
But, the chart gap was not the only reason we anticipated higher prices. The weight of evidence suggested higher prices too. And yes, I know there were many uber-bears out there pronouncing doom-and-gloom, but they didn’t look at a broad spectrum of indicators.
The February 26, 2023 Profit Radar Report was just one of many updates that stated: “It’s tough to pinpoint potential down side targets, but the weight of evidence (i.e. different breadth studies, pre-election seasonality, open chart gaps, barometers) still suggests that any losses will be reversed.”
Below is a visual expression of the weight of evidence published in the 2023 S&P 500 Forecast. Well over 100 studies have been added since, but even back in January, the Risk/Reward Heat Map showed that bullish studies (green columns) outnumbered bearish studies (red columns) by a large margin (projecting positive price development).
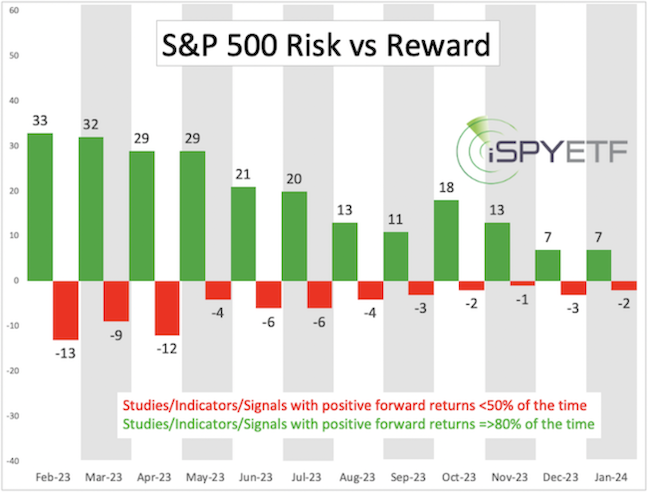
As the weight of evidence (Risk/Reward Heat Map) suggested, the S&P 500 moved higher, and the Nasdaq-100 soared higher (as a little exercise, do you know if the Nasdaq-100 has any open chart gaps left? Try to find out ... or sign up for the Profit Radar Report :)
Now, however, the S&P 500 will no longer be pulled higher by the magnetic attraction of an open chart gap. The rally guarantee has been removed.
In addition, the 61.8% Fibonacci retracement level, a common bear market rally reversal zone, is only about 3% away. As highlighted in the first chart, the S&P is in an inflection zone. An inflection zone doesn’t guarantee a turnaround, but if the S&P 500 is going to falter, it will likely do so here.
Obviously, there are many reasons why stocks should decline, the financial media talks about them every day. But think about it, there’ve been tons of reasons broadcasted over the past year, and none of them sunk stocks as expected.
Debt ceiling, rally led by only a few mega cap stocks, banking crisis, rising interest rates, inflation, war. One by one, the Profit Radar Report explained in real time why those reasons are not historically bearish for stocks.
As the S&P 500 has now reached its up side target and is in its inflection zone, risk has increased. Based on my interpretation of the weight of evidence, I would expect a temporary pullback in the inflection zone followed by an eventually rally to new recovery highs.
The market (and world scene) are incredibly dynamic, so I continue to monitor the weight of evidence. Weight of evidence means objectively evaluating how certain conditions (I.e. mega cap domination, breadth readings, sentiment, economic reports, price action, + dozens of other events analyzed every month) have affected the stock market in the past and extrapolate that into the future via the Risk/Reward Heat Map.
For continued updates, purely fact based research, and objective analysis, sign up for the Profit Radar Report.
The Profit Radar Report comes with a 30-day money back guarantee, but fair warning: 90% of users stay on beyond 30 days.
Barron's rates iSPYETF a "trader with a good track record," and Investor's Business Daily writes "Simon says and the market is playing along."
|
