I spend a lot of time plotting intricate charts illustrating technical patterns and developments, sentiment extremes and seasonal biases.
Perhaps my most impactful chart this year was featured in the 2014 S&P 500 Forecast (published by the Profit Radar Report on January 15).
This chart combined all my analysis into one simple S&P 500 projection for 2014 (view S&P 500 projection chart here).
If you click on the link above you’ll notice that the projection was about as accurate as anything in the financial world can be.
I’d like to think that charts have value, but the effectiveness of any chart crafted since early May pales in comparison to the uncanny accuracy of this rudimentary and unscientific indicator.
Headline Indicator or ‘Blind Guides’
The headline indicator is simply an assessment of media sentiment. Unfortunately, many retail investors listen to the media, making this a helpful contrarian indicator.
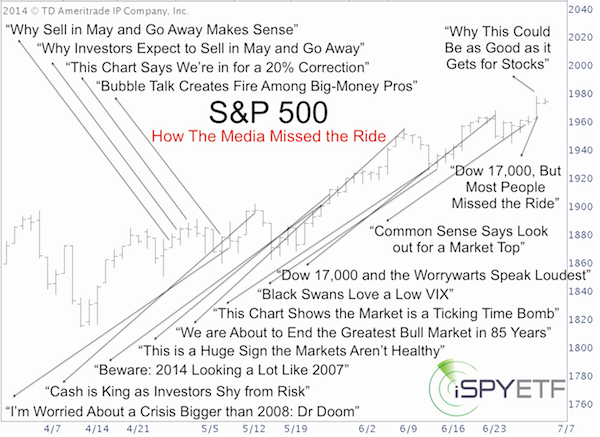
Below is a brief chronicle of the media’s uncanny prowess to support the wrong side of the trade along with commentary by the Profit Radar Report.

You’ll be surprised to read just how wrong the financial press has been (the S&P 500 chart below includes even more media headlines).
April 30, 2014 – S&P 500 at 1,884
April 30, Profit Radar Report: “The old and chewed-out ‘sell in May and go away’ adage is getting a lot of play these days. I get suspicious when our carefully crafted outlook becomes the trade of the crowd and a crowded trade. How will the market fool the crowded trade?”
The media’s take:
-
CNBC: “Why sell in May adage makes sense this year: Strategist”
-
IBD: “Why investors expect to sell in May and go away”
-
MarketWatch: Risk of 20% correction highest until October
May 11, 2014 – S&P 500 at 1,878.48
May 11, Profit Radar Report: “How will the market fool the crowded trade? A breakout to the up side with the possibility of an extended move higher.”
The media’s take:
-
Bloomberg: “The next liquidation crisis: What are the signals?”
-
CNBC: “I’m worried about a crisis bigger than 2008: Dr Doom”
-
Bloomberg: “U.S. markets on brink of 11% correction”
June 11, 2014 – S&P 500 at 1,944
June 11, Profit Radar Report: “Different day, same story: Stocks are near their all-time highs, but the media treats this advance with outright contempt. Below is a small selection of today’s headlines. We can’t dismiss media sentiment as retail investors (unfortunately) listen to the media.”
The media's take:
-
CNBC: "Cramer: Prepare for stock decline"
-
WSJ: "How long can stocks maintain all-time highs?"
-
MarketWatch: "3 reasons why the Dow shouldn’t be at 17,000"
June 25, 2014 – S&P 500 at 1,959
June 25, Profit Radar Report: “It only took one small down day (Tuesday) to reinvigorate media fear mongers.”
The media's take:
-
Yahoo: “S&P’s Stovall says be careful before jumping into stagnant market”
-
Yahoo: “’It looks like a peak:’ Robert Shiller’s CAPE is waving the caution flag”
-
CNBC: “Wall Street’s biggest bull calls for a correction.”
Irony at its Worst
A correction would actually be healthy, but a watched pot doesn’t boil.
The June 25 Profit Radar Report explains: “The media’s continuous market top calling, artificially extends every rally. We saw this in April/May. Although media pessimism isn’t as pronounced today as it was in April/May, it’s enough to be considered a bullish wild card.
Bull markets die or correct because of ‘starvation.’ The market needs potential buyers to fuel rallies. That’s why good news tops are dangerous, because they suck in so many buyers and leave few sellers. Where there’s no buyer, there’s no price increase. ‘Scary’ media headlines disturb this cycle and provide continuous ‘ammunition’ for the bull.”
Today – S&P 500 at 1,973
On Monday the S&P 500 closed at 1,973. What does the media say?
-
CNBC: “Why this could be as good as it gets for stocks”
-
Yahoo: "Common sense says look out for a market top"
-
USA Today: “History says July is cool time to own stocks”
-
WSJ: "Dow nears 17,000 as rally gains steam"
Yes, you saw correctly, there are actually two headlines with a bullish connotation, but the most fitting headline comes from MarketWatch.
“Dow flirts with 17,000, but most people missed the ride”
Hmmm, let’s see if the media can crack the mystery behind the missed rally.
It is obviously premature to order a coffin for this rally (or the entire bull market), but several indicators – one of them is the ‘sudden drop’ indicator – suggest caution.
This 'sudden drop' indicator has a flawless record since the beginning of the QE bull market in 2009. Is it reason to worry.
Here is a detailed look at the 'sudden drop' index: S&P 500 'Sudden Drop' Index at Historic Extreme
Simon Maierhofer is the publisher of the Profit Radar Report. The Profit Radar Report presents complex market analysis (S&P 500, Dow Jones, gold, silver, euro and bonds) in an easy format. Technical analysis, sentiment indicators, seasonal patterns and common sense are all wrapped up into two or more easy-to-read weekly updates. All Profit Radar Report recommendations resulted in a 59.51% net gain in 2013.
Follow Simon on Twitter @ iSPYETF or sign up for the FREE iSPYETF Newsletter to get actionable ETF trade ideas delivered for free.

|
