In terms of actual trading recommendations, 2016 has been a fairly quite year for the Profit Radar Report. We’ve had only seven actual trade recommendations (only one losing trade).
Barron's rates iSPYETF as a "trader with a good track record." Click here for Barron's assessment of the Profit Radar Report.
Until last week, the only stock-related trade was the S&P 500 buy at 1,828 on February 11 (closed on March 17 for a 11.6% gain).
Based on hindsight, not trading the choppy range from March 20 to June 8 has been the right decision.
Stalking Pays Off
Starting on May 24, the Profit Radar Report was looking for a false S&P 500 breakout and subsequent reversal.
After stalking the S&P 500 for two weeks for a low-risk entry, our carefully selected short trigger was met at 2,110 on June 9 (click here for more details on how we ‘stalked’ the S&P and avoided shorting prematurely). The corresponding ETF trade was to buy the ProShares Short S&P 500 ETF (SH) at 19.80.
This became the first S&P 500 trade since February 11, 2016. What’s special about this trade?
The FOMO (Fear of Missing Out) Trade
The chart below (published in the June 8 Profit Radar Report) shows that the ATR (average true range) dropped to the lowest level since June 29, 2015. ATR is a measure of volatility, and it showed a dangerous level of complacency (dotted red arrows).
If you enjoy quality, hand-crafted research, >> Sign up for the FREE iSPYETF Newsletter
As the horizontal red lines indicate, there was a cluster of resistance levels at 2,110 – 2,139. There was also an obvious bearish divergence on the hourly chart (not shown).
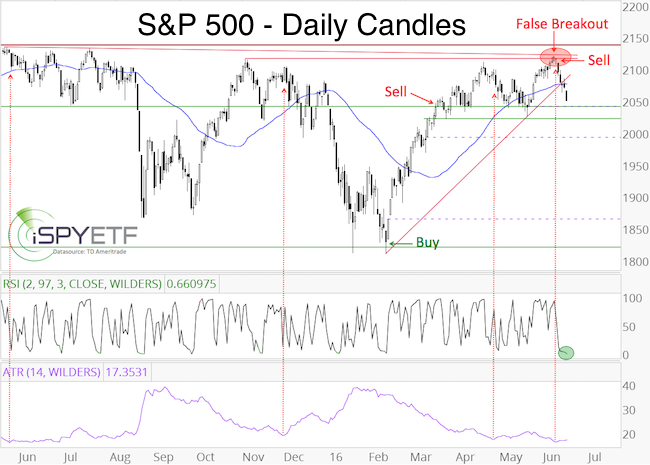
In short, the S&P was ripe for a reversal in a strong resistance range. The ingredients for a pullback where in place. The fact that the S&P 500 was near its all-time high (which means considerable down side potential) added to the intrigue.
Therefore, the June 8 Profit Radar Report stated the following:
“At this point, we can’t quantify the maximum down side risk, but we know there’s potential for a deeper pullback once this rally is complete. We are attempting to carefully short so we have some skin in the game should there be a sizeable decline. This is an insurance trade against missing out. We will go short if the S&P 500 drops below 2,110.”
The decline since the June 8 high has been kind of odd. The S&P 500 has been down for six consecutive days, the VIX went soaring (click here for recent VIX anomalies), but the S&P loss has been relatively small (2.8%).
At this point, the S&P is oversold, by may have entered a powerful wave 3 down (according to Elliott Wave Theory). There are a number of open chart gaps, which suggest that the S&P will recover once this correction is done.
Continued S&P 500 analysis is available via the Profit Radar Report.
Simon Maierhofer is the founder of iSPYETF and the publisher of the Profit Radar Report. Barron's rated iSPYETF as a "trader with a good track record" (click here for Barron's profile of the Profit Radar Report). The Profit Radar Report presents complex market analysis (S&P 500, Dow Jones, gold, silver, euro and bonds) in an easy format. Technical analysis, sentiment indicators, seasonal patterns and common sense are all wrapped up into two or more easy-to-read weekly updates. All Profit Radar Report recommendations resulted in a 59.51% net gain in 2013, 17.59% in 2014, and 24.52% in 2015.
Follow Simon on Twitter @ iSPYETF or sign up for the FREE iSPYETF Newsletter to get actionable ETF trade ideas delivered for free.

If you enjoy quality, hand-crafted research, >> Sign up for the FREE iSPYETF Newsletter
|
