Stock valuations, excessive investor optimism, Greece, falling oil prices, etc. There are plenty of reasons to worry, but none of the above has had a negative impact in recent months.
The biggest concern is unseen und largely unreported: Internally weak market breadth.
Let’s take one segment of the stock market as example: Small cap stocks.
Small cap stocks lagged the S&P 500 (NYSEArca: SPY) for much of 2014. In fact, if we got a nickel for every market commentator who predicted a crash just because small caps dropped more than 10% last year, we’d be having this conversation over a lavish Wall Street style dinner with all the fixings.
Looking for more stock market analysis? >> Sign up for the FREE iSPYETF e-Newsletter
But in reality, small cap stocks (NYSEArca: IWM) just rallied to new all-time highs … and everything is now back to hunky-dory. Really?
Everyone sees the new all-time highs, but barely anyone is aware of the internal market deterioration. To illustrate:
-
In March 2014, 36% of small cap stocks were within striking distance of their 52-week high. 8% of small cap stocks were down 20% or more.
-
In July 2014, 22% of small cap stocks were within striking distance of their 52-week high. 11% of small cap stocks were down 20% or more.
-
Now, 21% of small cap stocks are within striking distance of their 52-week high. 25% are down 20% or more.
In addition, trading volume flowing into advancing stocks has been declining.
The same is true for most major U.S. indexes.
Thus far, the internal deterioration has been masked by strong price action and complacent trading activity (see Average True Range at bottom of chart).
But, the daily S&P 500 chart shows waning momentum (RSI) and MACD at the brink of giving a sell signal.
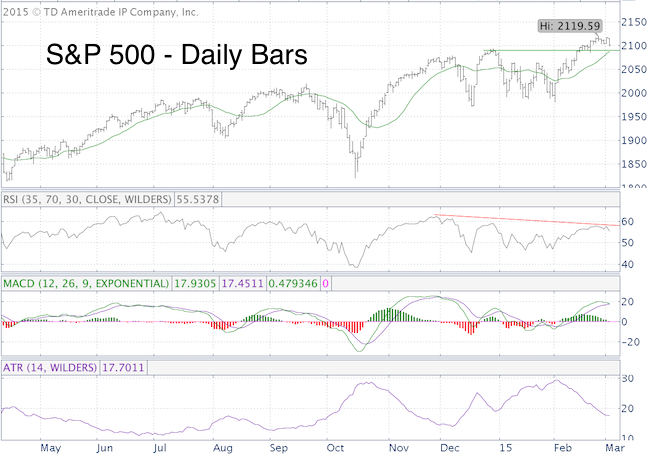
Important support is around 2,090. A break below support is likely to open up a can of worms.
The only caveat is that the popular 20-day SMA is right around 2,090, so there may be some fake out moves right around that level.
How low can stocks go? What's the down side target? More details here
Simon Maierhofer is the publisher of the Profit Radar Report. The Profit Radar Report presents complex market analysis (S&P 500, Dow Jones, gold, silver, euro and bonds) in an easy format. Technical analysis, sentiment indicators, seasonal patterns and common sense are all wrapped up into two or more easy-to-read weekly updates. All Profit Radar Report recommendations resulted in a 59.51% net gain in 2013 and 17.59% in 2014.
Follow Simon on Twitter @ iSPYETF or sign up for the FREE iSPYETF Newsletter to get actionable ETF trade ideas delivered for free.

|
