Subscribers to iSPYETF’s free e-mail newsletter receive a market outlook, usually once a week. The market outlook below was sent out on April 13, 2023. If you’d like to sign up for the free e-newsletter, you may do so here (we will never share your e-mail with anyone, just as we don't accept advertising).
It's been a quiet week, but prior to that the S&P 500 soared 300 points ... despite last month's bank crisis. As Reuters put it, that "bank crisis raises specter of 2008" and crash warnings were everywhere.
However, credit spreads said that things were not nearly as bad as they appeared. Credit spreads are one of the best ways to gauge the actual industry stress level. Why?
Credit spreads measure the relationship between two interest rates. This is money talking, not just the media or surveys.
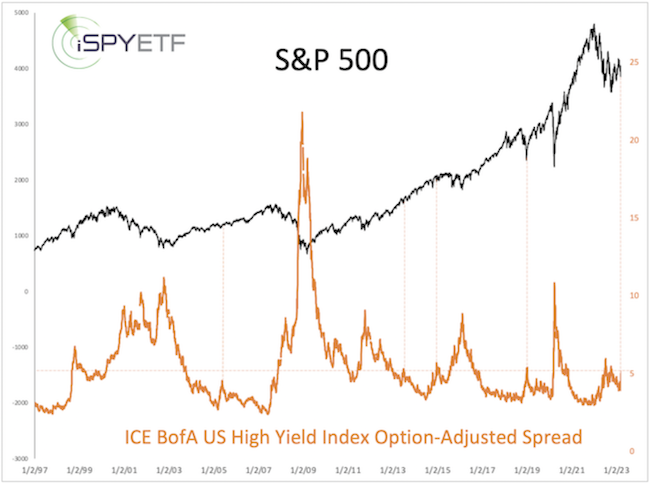
The chart below plots the S&P 500 against the ICE BofA US High Yield Option-Adjust Spread, which calculates the difference between a spot Treasury curve (very safe investment) and BB rated bonds (junk bonds).
During real stress money moves away from junk bonds into safe bonds and the spread soars. As the chart shows, aside from a minor spike, the spread barely moved and is way below prior peaks.
I published the chart above along with a more detailed analysis of banking stress in the March 19 Profit Radar Report and concluded that: "The facts still favors stocks holding up, rallying or coming back once this correction is over. There is a window for XLF and KBE to bounce."
The huge unnoticed development
While the above was a hugely unnoticed development (headline), it's not THE hugely unnoticed development. What is it?
In terms of market breadth, the 10-day SMA of advancing NYSE stocks soared from 35.25% on March 17 to 65.75% on March 31.
The chart below plots the S&P 500 against the 10-day SMA of NYC advancers. The insert shows the daily percentage of advancing stocks from March 17 - April 4 (shaded in blue is the March 17 - 31 period).
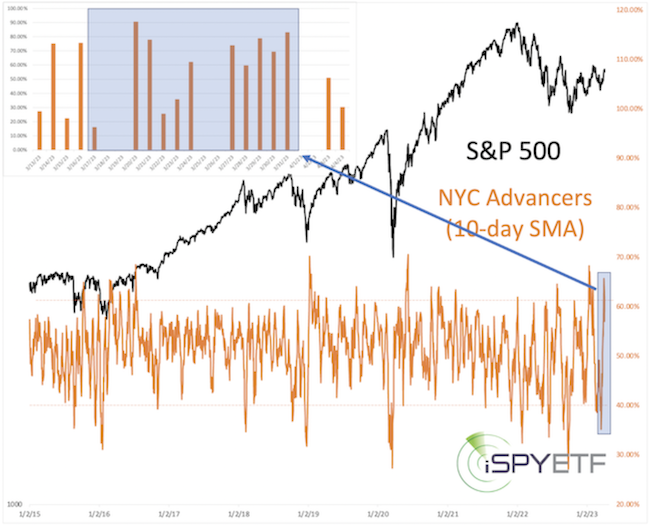
Based on the data I purchase, the 10-day SMA of NYC advancers went from <40% to >61.5% within 11 days (based on other data this was achieved in just 10-days), which is the definition of a Zweig Breadth Thrust (kind of like the gold standard of breadth thrusts).
This particular breath trust triggered only 9 other times (since 1970).
I love sample sizes of around 10. Not too few, not too many, it's a signal that means something and still has history.
The S&P 500 forward performance after the prior 9 signal was incredibly consistent and carries a lot of weight.
I shared the complete forward performance data with subscribers on Sunday. I won't share it here, but I will say that this study is in direct conflict with an incredibly narrow-minded statement made by the biggest Elliott Wave forecasting service:
"We continue to think it's a developing bear market, and that's that. If we turn out wrong, we will have to eat crow. Discussing alternative possibilities would be a distraction."
This service is expecting a nasty wave 3 crash. While I can't dismiss this as a possibility (it's one of many wave developments I track), I feel sorry for their subscribers who may have to eat crow because their analysts refuse to consider very compelling evidence just because it doesn't fit into their bearish narrative.
I can't promise to be right, but I promise to always look at the body of evidence to come up with an educated conclusion. Looking at 'alternative possibilities' (or the weight of evidence) is never a distraction, it's an absolute necessity.
Above is a quick look at the S&P 500. It seems like my inclination shared in the April 2 Profit Radar Report is coming to fruition: "It is possibly that stocks will suffer a smaller pullback starting next week, recover and grind towards 4,200 - 4,300."
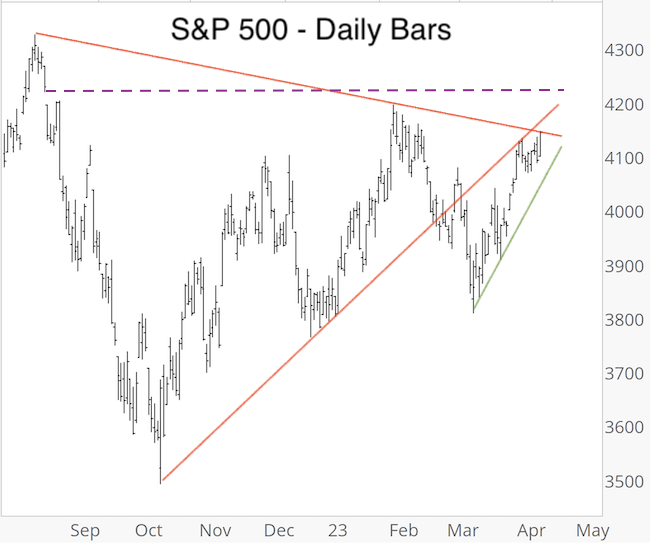
Once we get there, it's probably time to be more cautious as this is an inflection zone.
For continued updates, purely fact based research, and objective analysis, sign up for the Profit Radar Report.
The Profit Radar Report comes with a 30-day money back guarantee, but fair warning: 90% of users stay on beyond 30 days.
Barron's rates iSPYETF a "trader with a good track record," and Investor's Business Daily writes "Simon says and the market is playing along."
|
