The June 23 Profit Radar Report featured the following VIX analysis:
“The VIX closed below the lower Bollinger Band for the first time since June 6, 2014. It is at the general support zone at 12. The next support zone is at 11. A close back above the lower Bollinger Band will be a buy signal.
VIX seasonality is soon turning higher for the best VIX seasonal signal of the year. Profiting from a rising VIX is always made tougher by contango, which persistently erodes returns of VIX related ETFs like VXX. Nevertheless, the best VIX buy signal of the year appears imminent. We would certainly be buyers at 11. For now, we’ll place a buy limit order (small initial amount) for VXX at 16.90.”
The significance of the close below the lower Bollinger Band was enhanced by VIX seasonality.
Seasonality is not an exact science, but 24 years of VIX history have carved out certain patterns that repeat more often than not.
If you enjoy quality, hand-crafted research, >> Sign up for the FREE iSPYETF Newsletter
One of those patterns is an early July VIX bottom.
The chart below plots the VIX against VIX seasonality.
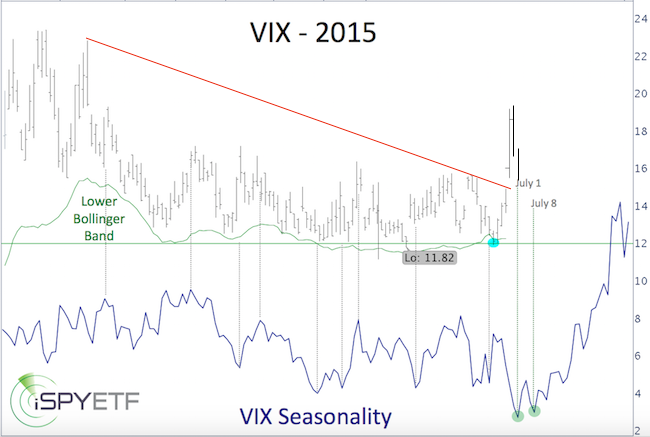
Thanks to Greece, the VIX bottom may have arrived a few days earlier, making it tougher for latecomers to buy at the bottom.
Nevertheless, the VIX seasonality chart suggests we may see another opportunity to buy VIX related ETNs like the iPath S&P 500 Volatility ETN (NYSEArca: VXX) or VelocityShares Daily 2x Short-term Volatility ETN (NYSEArca: TVIX) next week.
Simon Maierhofer is the publisher of the Profit Radar Report. The Profit Radar Report presents complex market analysis (S&P 500, Dow Jones, gold, silver, euro and bonds) in an easy format. Technical analysis, sentiment indicators, seasonal patterns and common sense are all wrapped up into two or more easy-to-read weekly updates. All Profit Radar Report recommendations resulted in a 59.51% net gain in 2013 and 17.59% in 2014.
Follow Simon on Twitter @ iSPYETF or sign up for the FREE iSPYETF Newsletter to get actionable ETF trade ideas delivered for free.

If you enjoy quality, hand-crafted research, >> Sign up for the FREE iSPYETF Newsletter
|
