Subscribers to iSPYETF’s free e-mail newsletter receive a market outlook, usually once a week. The market outlook below was sent out on December 2, 2021. If you’d like to sign up for the free e-newsletter, you may do so here (we will never share your e-mail with anyone, just as we don't accept advertising).
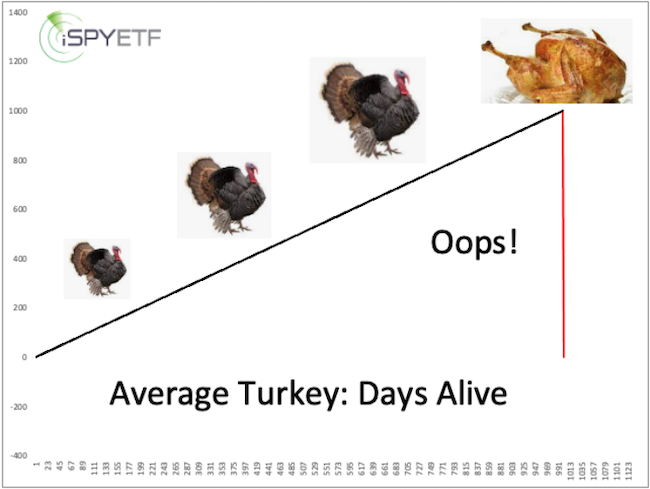
I tweeted this chart prior to Thanksgiving. Turns out turkeys weren't the only diminishing 'asset' this time around, stocks took an 'oops' too.
For much of 2020 and 2021 we shelved Elliott Wave Theory, but prior to Thanksgiving I made this statement in the Profit Radar Report:
"Monday's (Nov. 22) intra-day high could have concluded what can be interpreted as a 5-wave rally from the October 4 low."
The decline from the November 22 high, although unusual for this time of year, wasn't a total surprise, and neither is today's pop.
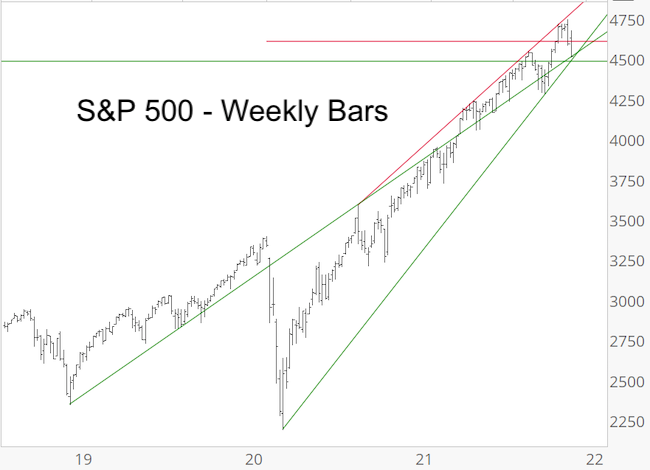
Yesterday's Profit Radar Report featured this S&P 500 chart, with support right around 4,500 (this morning's low was 4,504). It's certainly possible that stocks will relapse and fall further, but 2021 has taught us not to front run the down side.
The last week of market action has delivered some eyebrow-raising developments.
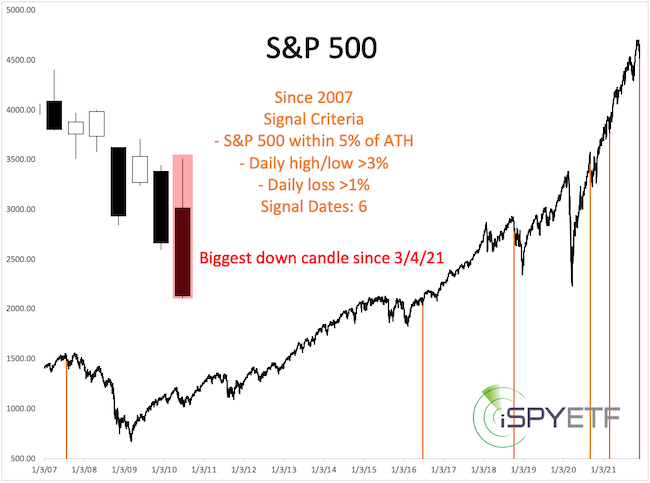
1) The S&P 500 fell 3.16% from yesterday's high to close near the daily low. This created the biggest such candle since 3/4/21. When within 5% of an all-time high, the S&P carved out similar candles 24 other times. The chart below highlights the 6 signal dates since 2007.
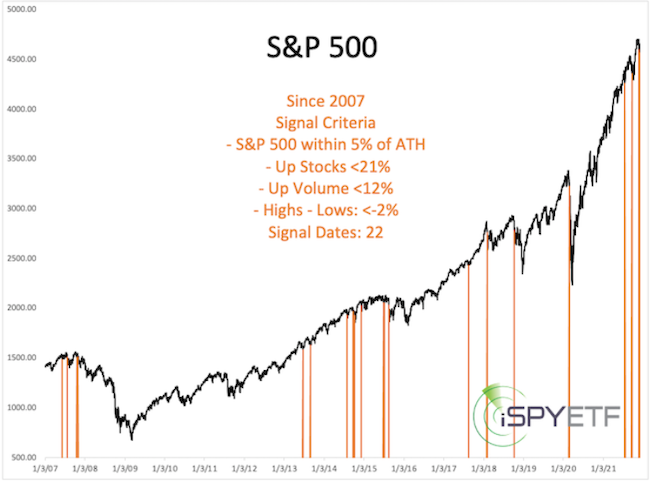
2) Stocks suffered two rather negative breadth days since Thanksgiving.
11/26/21: 85.90% declining stocks, 90.62% declining volume
11/30/21: 79.29% declining stocks, 88.00% declining volume
Similar days, when within 5% of an ATH, occurred 24 times, 22 of those since 2007 (see chart below). But, 2 signals within 3 days happened only once before (I shared that date with subscribers).
3) Last Friday, the VIX popped 54.04%, the fourth biggest one-day spike ever. Since inception of the VIX, there were only 7 other times when the VIX jumped more than 40% while the S&P was within 5% of its all-time high.
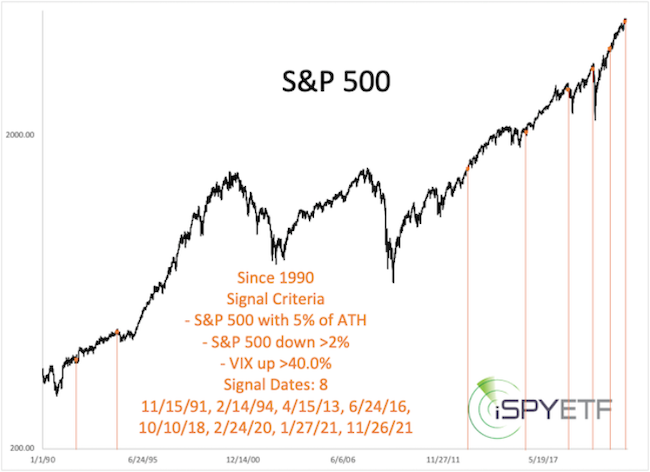
What's the point of all the data?
As a DIY investor look at how many signal dates (orange lines) preceded major selloffs. This helps you gauge the risk of a correction or bear market.
The Profit Radar Report makes this easier by providing forward returns for the next 1, 2, 3, 6, 9, 12 months following each signal.
The above charts certainly include signal dates that turned out to be significant market tops. Therefore, we are alert of this possibility. But, it will take sustained trade below important support to confirm.
It's interesting that many analysts that were bullish a week ago have out of a sudden turned bearish. The ones who predicted the selloff are the ones that have been crying 'bear' every time stocks dipped a percent or two.
Others deliver cliches like "the easy money has been made" or "the market is closer to a top than a bottom" (I just read that one, which is a ridiculous statement considering the bottom is a 52% drop away).
We live in probably the most unique market environment ever. The only way to gain an edge is to rely on objective facts.
Continued updates, out-of-the box analysis and forward performance based on historic precedents (Risk/Reward Heat Map) are available via the Profit Radar Report.
The Profit Radar Report comes with a 30-day money back guarantee, but fair warning: 90% of users stay on beyond 30 days.
Barron's rates iSPYETF a "trader with a good track record," and Investor's Business Daily writes "Simon says and the market is playing along."
|
