Subscribers to iSPYETF’s free e-mail newsletter receive a market outlook, usually once a week. The market outlook below was sent out on April 15. If you’d like to sign up for the free e-newsletter, you may do so here (we will never share your e-mail with anyone, just as we don't accept advertising).
Everyone knows that S&P 500 and Dow Jones price action has been as pristine as it's been boring ... and there's a trace of that's 'too good to be true' in the hair.
I wanted to find out how the most recent rally stacks up to others in the past and if that calm turned out to be the calm before the storm. Here is what I found.
I personally don't like chasing an over-bought market (although that's not been a great mantra to live by) and prefer lower-risk setups ... like this one discussed in the April 11 Profit Radar Report (chart includes original annotations but updated price):
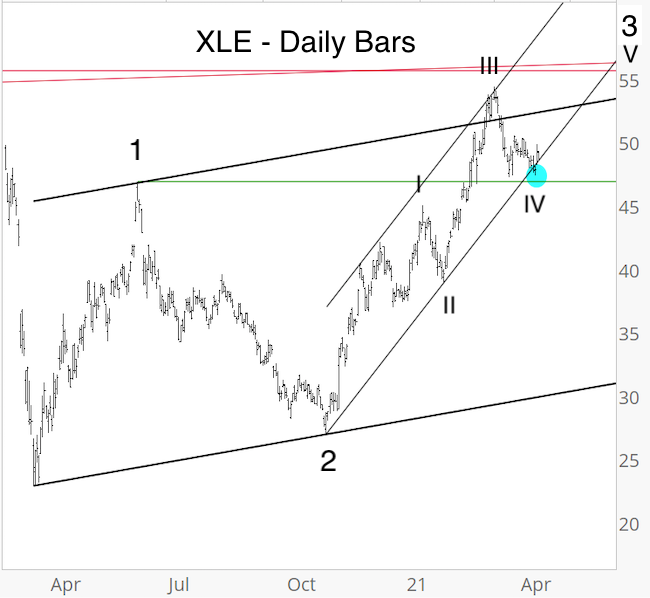
"There’s been a fierce battle between value and growth - risk on vs risk off sectors. XLE appears to offer one of the more attractive entry levels near current price. XLE is testing the trend channel (48) with next support around 46.80 (blue circle).
The chart includes a potential Elliott Wave Theory count, which makes an eventual rally into the 55.65 zone likely. Wave 4 (or IV) corrections can be complex and drawn out, but buying XLE around current price or after a quickly reversed dip below the trend channel looks attractive. More aggressive investors may buy XLE around current price, but we’ll look at buying XLE after a successful test of the 47.20 zone."
Who would have thought that short TSLA is the new S&P or Nasdaq FOMO (fear of missing out) trade?
But there was a solid setup to short TSLA, as discussed in Monday's special Profit Radar Report update (chart includes original annotations but updated price):
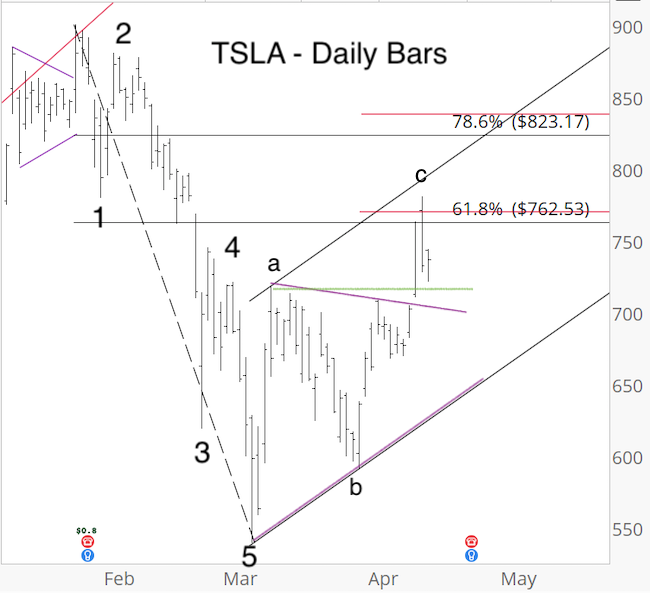
"TSLA closed at 762 today. According to Elliott Wave Theory (EWT), the decline from the January high to March low traced out 5 waves. The bounce from the March low looks like 3 waves. The 78.6% Fibonacci retracement is at 762.53 and wave c = wave a at 769.37.
The TSLA bounce could finish in the 762 - 769 zone. Additional resistance is around 795 (trend channel) and 823 - 838 (78.6% retracement and C = 1.382 x A).
EWT has been essentially useless for the major indexes and excess liquidity may also void this signal, but it’s been rare to get such a clear read and confluence of resistance levels like seen here.
As mentioned, TSLA is a fast-moving stock not for the faint of heart . We will initiate a small short position at tomorrow’s (Wednesday) open."
TSLA opened at 770.70 on Wednesday and quickly fell to 730. There is a small chance that TSLA will still reach the 823 - 838 range (breakout of the purple triangle) but with a stop-loss at breakeven we can wait if TSLA finds support around 700 - 710 or not.
Continued updates and factual out-of-the box analysis are available via the Profit Radar Report.
The Profit Radar Report comes with a 30-day money back guarantee, but fair warning: 90% of users stay on beyond 30 days.
Barron's rates iSPYETF a "trader with a good track record," and Investor's Business Daily writes "Simon says and the market is playing along."
|
