The July 4, 2016 Profit Radar Report featured the following S&P 500 projection.
Based on this projection, the S&P was to rally to about 2,195 followed by a pullback to about 2,155.
Barron's rates iSPYETF as a "trader with a good track record." Click here for Barron's assessment of the Profit Radar Report.
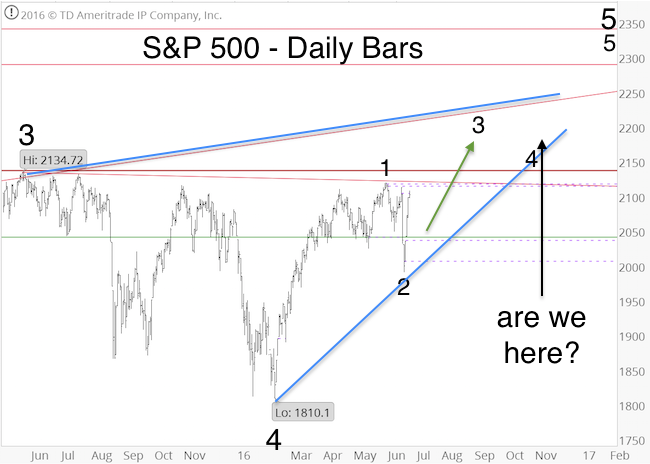
Despite a prolonged trading range, the S&P followed this projection very closely. It rallied as high as 2,193.81 and subsequently slid as low as 2,157.09 (see ‘are we here’ arrow).
Does that mean that the next leg higher us about to launch?
The Big Question
It could be. The question is whether stocks will correct further before the next rally or not.
Under normal condition, stocks should pull back further. However, we’ve seen one of the longest and tightest trading ranges in history (July 14 until today).
This trading range was enough to digest over bought readings caused by the post-Brexit spike. We may have just seen a correction in time rather than price.
However, in terms of seasonality, September is the worst month of the year. Buying in September is less than ideal.
If you enjoy quality, hand-crafted research, >> Sign up for the FREE iSPYETF Newsletter
October, on the other hand, has often served as launching pad, most recently in 2014 and 2015.
Best Setup
Further weakness with targets around 2,150 – 2,130 and 2,130 – 2,070 reached later in September or in October would certainly set up a much better buying opportunity than chasing price around 2,200 in September.
We consider any pullback into the above ranges a gift. Life is always more pleasant if you receive a present. If we’ll get it, we’ll certainly accept it (buy stocks), but we can’t bank on it.
If the market moves higher soon without noteworthy pullback, we’ll have to deal with it, and determine whether it’s a temporary or a sustainable move higher.
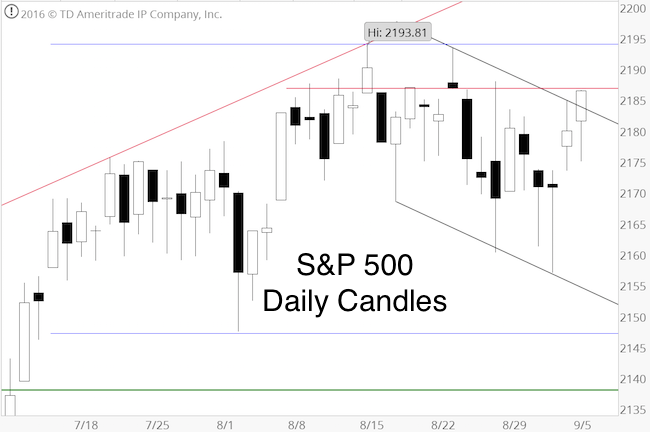
Short-term, the S&P has broken outside of the descending black trend channel (see chart above), but the put/call ratio and short-term RSI suggest some weakness. It will take sustained trade above 2,187 (red resistance line) for the S&P to venture higher.
Continued updates are available via the Profit Radar Report.
Simon Maierhofer is the founder of iSPYETF and the publisher of the Profit Radar Report. Barron's rated iSPYETF as a "trader with a good track record" (click here for Barron's profile of the Profit Radar Report). The Profit Radar Report presents complex market analysis (S&P 500, Dow Jones, gold, silver, euro and bonds) in an easy format. Technical analysis, sentiment indicators, seasonal patterns and common sense are all wrapped up into two or more easy-to-read weekly updates. All Profit Radar Report recommendations resulted in a 59.51% net gain in 2013, 17.59% in 2014, and 24.52% in 2015.
Follow Simon on Twitter @ iSPYETF or sign up for the FREE iSPYETF Newsletter to get actionable ETF trade ideas delivered for free.

If you enjoy quality, hand-crafted research, >> Sign up for the FREE iSPYETF Newsletter
|
