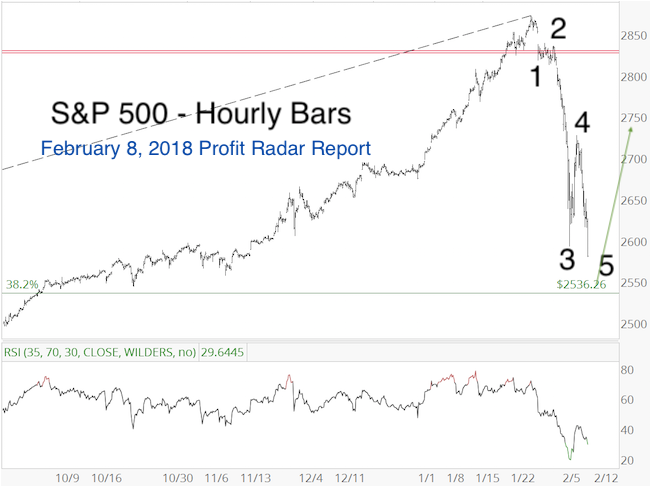
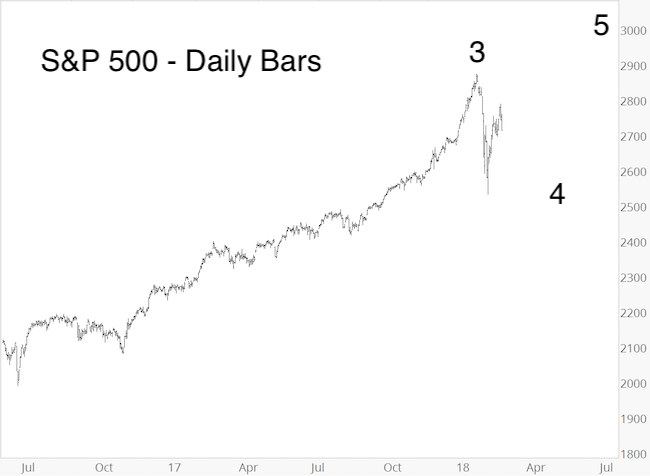
The February 11 Profit Radar Report featured the chart below and stated that: “Based on Elliott Wave Theory, wave 3 is followed by wave 4, which is where we are currently at. Waves 4 are generally choppy, range-bound, long-winded, unpredictable corrections that retrace ideally 38.2% of the preceding wave 3. The 38.2% Fibonacci retracement level is at 2,536 (reached on Friday). In terms of price, wave 4 has already reached its down side target. In terms of time, wave 4 would be unusually short.”
After hitting 2,536 on February 9, the S&P 500 rallied as projected by this chart shown in the February 8 Profit Radar Report (Tuesday’s high at 2,789 was a bit higher than outlined in the last S&P 500 update).
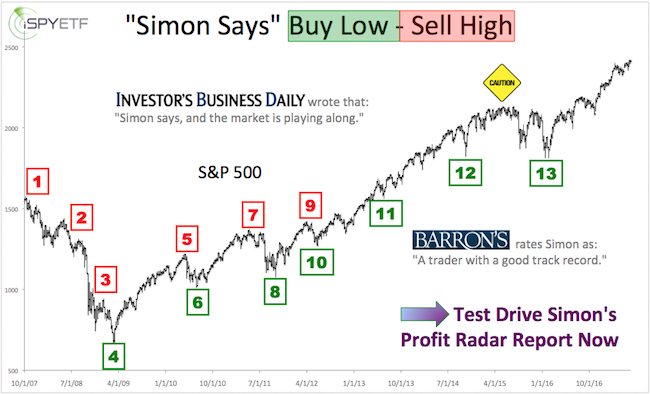
Barron's rates iSPYETF as "trader with a good track record" and Investor's Business Daily says: "When Simon says, the market listens." Find out why Barron's and IBD endorse Simon Maierhofer's Profit Radar Report.
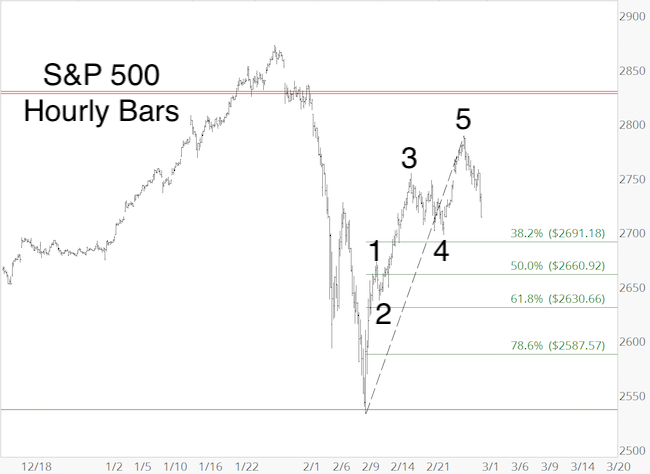
It is possible to count 5 waves up from the February 9 low to the February 27 high.
A 5-wave rally is always followed by a pullback, that’s why the February 25 Profit Radar Report mentioned the possibility of a ‘false breakout.’ The chart below shows the wave labels and common Fibonacci retracement support levels (particularly applicable for scenario #1).
Bigger Picture
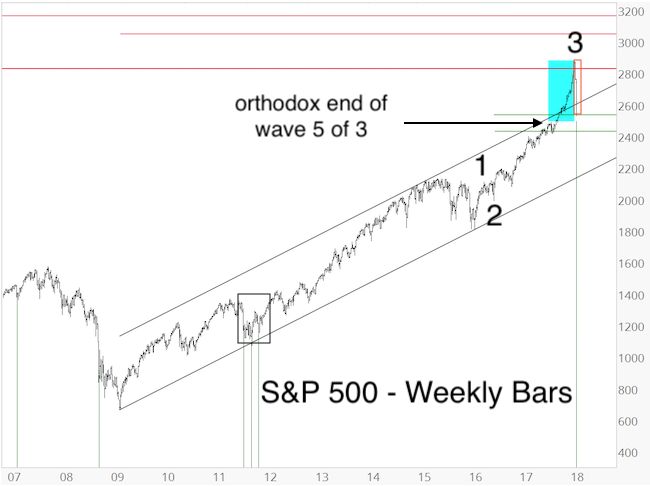
The two charts below outline how the rally from the February 9 low and the decline from the February 27 high may fit into the bigger picture.
If you enjoy quality, hand-crafted research, >> Sign up for the FREE iSPYETF Newsletter
Scenario #1 assumes that wave 4 completed on February 9. The rally from February 9 – 27 is wave 1 of wave 5. Wave 2 of wave 5 is now underway (see hourly chart for common retracement levels for waves 2).
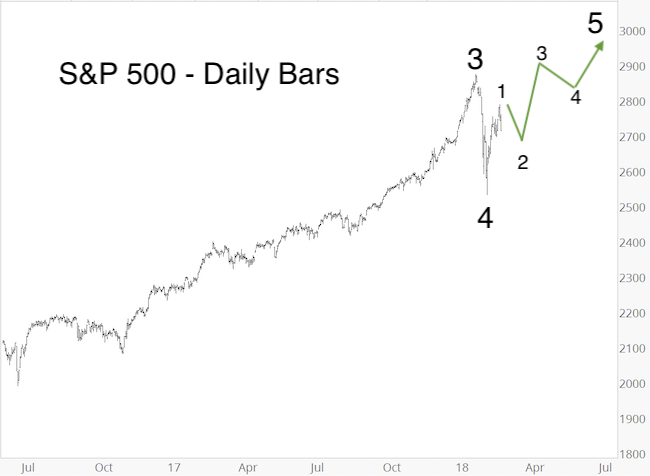
Scenario #2 projects an ongoing, choppy wave 4 correction and eventual retest of the February panic low.
Both scenarios have a common denominator: Lower prices followed by new highs. The shape of the decline should tell us which scenario we’re dealing with.
Summary
Barring a low-odd waterfall decline, the weight of evidence suggests a buy the dip approach. This approach is supported by probably the most important seasonal pattern of 2018.
Continued updates with down side targets are available via the Profit Radar Report.
Simon Maierhofer is the founder of iSPYETF and the publisher of the Profit Radar Report. Barron's rated iSPYETF as a "trader with a good track record" (click here for Barron's profile of the Profit Radar Report). The Profit Radar Report presents complex market analysis (S&P 500, Dow Jones, gold, silver, euro and bonds) in an easy format. Technical analysis, sentiment indicators, seasonal patterns and common sense are all wrapped up into two or more easy-to-read weekly updates. All Profit Radar Report recommendations resulted in a 59.51% net gain in 2013, 17.59% in 2014, and 24.52% in 2015.
Follow Simon on Twitter @ iSPYETF or sign up for the FREE iSPYETF Newsletter to get actionable ETF trade ideas delivered for free.
If you enjoy quality, hand-crafted research, >> Sign up for the FREE iSPYETF Newsletter
|
