Throughout January and February (but especially since going long on February 11), the Profit Radar Report has been harping about the ‘need’ for the open chart gap at 2,043.62 to be closed.
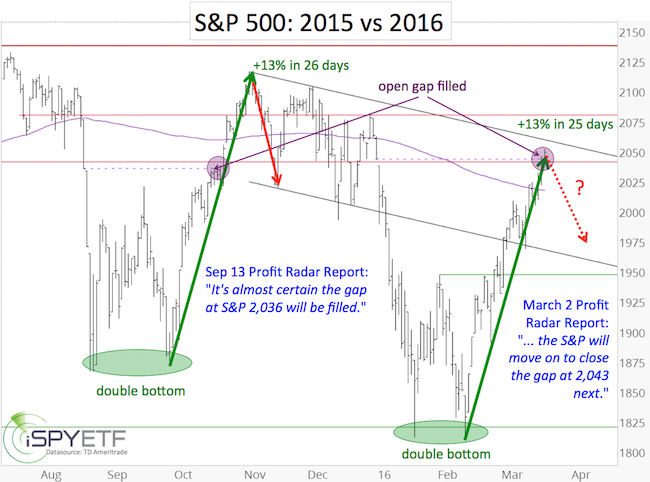
On March 2, for example, the Profit Radar Report stated that: “If the S&P can overcome 1,990, it will probably move on to close the open chart gap at 2,043 next.”
The gap was closed last Thursday. Will the S&P 500 push deeper into the resistance zone that starts at 2,040 (2,040 – 2,080), or will it relapse, or both?
Re-launch or Re-lapse? Volume
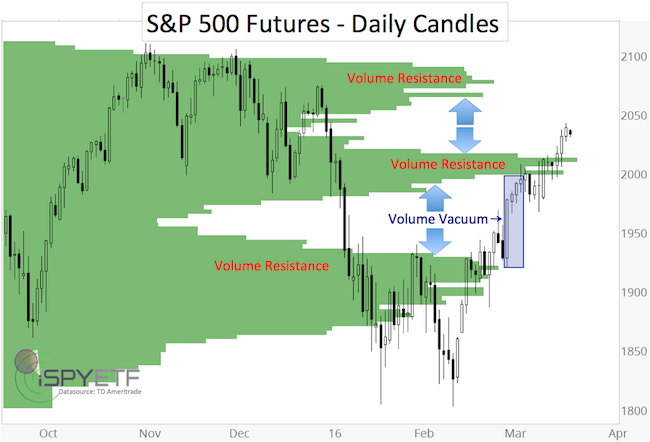
About a month ago, we looked at a different kind of trading volume analysis (horizontal instead of vertical). The horizontal columns below show trading volume for the S&P 500 futures, based on price (horizontal) not day (vertical).
This kind of horizontal volume analysis was introduced via the February 15 Profit Radar Report, which stated the following:
“A lot of shares were exchanged right around the 1,900 level. Based on volume, this could be resistance, and if the 1,900 range is overcome it may get easier for price to moved towards 1,950 – 2,000.”
A hindsight look at the chart confirms that volume spikes or clusters acted as natural resistance zones, while volume vacuums (such as 1,935 – 1,995) resulted in quick ‘melt-ups.’
Last week, the S&P entered another volume vacuum, so slightly higher prices are possible before it hits the next volume spike resistance starting at 2,060 – 2,070.
If you enjoy quality, hand-crafted research, >> Sign up for the FREE iSPYETF Newsletter
Re-launch or Re-lapse? 2015 vs 2016
The chart below shows that the 2016 decline, double bottom and subsequent rally looks a lot like 2015, a parallel the Profit Radar Report has been pointing out since late January.
2015 - 2015 parallels:
-
The August 2015 mini meltdown left an open chart gap at 2,035.73, which we expected to get filled (just as the 2016 chart gap at 2,043.62). The 2015 gap was filled on October 20, the 2016 gap on March 17.
-
In 2016, the S&P 500 rallied after the January/February double bottom, in 2015 after the August/September double bottom.
-
In 2015, the S&P rallied 13% in 26 days. As of Friday, the S&P rallied 13% in 25 days.
-
In 2015 the S&P was 50 points above the 200-day SMA when it ran out of gas. Right now its about 30 points above the 200-day SMA.
If the parallel continues, this rally is ready for a breather.
If you enjoy quality, hand-crafted research, >> Sign up for the FREE iSPYETF Newsletter
Re-launch or Re-lapse? Liquidity
Following the 2015 August/September double bottom, the Profit Radar Report did a detailed liquidity analysis to assess the strength of the rally (free version of this study is available here: Is the Stock Market Running out of Buyers?). An updated version of this liquidity analysis (analyzing the rally from the February 2016 low), was published in the March 20, 2016 Profit Radar Report.
The conclusion? Market breadth (or liquidity) behind the rally off the September 29, 2015 low was the weakest in years and did not inspire confidence in sustainable gains. The early 2016 relapse was therefore no surprise.
Unlike the 2015 rebound (from the September low), the rebound from the February 2016 low has been much stronger. The February breadth thrust is discussed in detail here: 2016 Bear Market Risk is Zero Based on this Rare but Consistent Pattern
Re-launch or Re-lapse? All Things Considered
Indicators aside, down side risk today is obviously greater than it was at S&P 1,810. Chasing stocks after an 11% rally while approaching the upper end of an 18-month trading range doesn’t sound like a bright idea.
The February 28 Profit Radar Report stated that: “A move above 1,990 would unlock higher targets: 2,040 – 2,100.”
So, further up side is possible, but the risk/reward ratio is not attractive, because the odds of a pullback are elevated.
Nevertheless, a fair amount of indicators suggest that any pullback will only be temporary. How temporary?
Fortunately we don’t have to pinpoint the scope of an upcoming correction at this very moment. The market will likely provide enough tell-tale signs to either discern the down side target or the next likely turnaround.
Continued analysis is available via the Profit Radar Report.
Simon Maierhofer is the publisher of the Profit Radar Report. The Profit Radar Report presents complex market analysis (S&P 500, Dow Jones, gold, silver, euro and bonds) in an easy format. Technical analysis, sentiment indicators, seasonal patterns and common sense are all wrapped up into two or more easy-to-read weekly updates. All Profit Radar Report recommendations resulted in a 59.51% net gain in 2013, 17.59% in 2014, and 24.52% in 2015.
Follow Simon on Twitter @ iSPYETF or sign up for the FREE iSPYETF Newsletter to get actionable ETF trade ideas delivered for free.

If you enjoy quality, hand-crafted research, >> Sign up for the FREE iSPYETF Newsletter
|
