Subscribers to iSPYETF’s free e-mail newsletter receive a market outlook, usually once a week. The market outlook below was sent out on July 9, 2022. If you’d like to sign up for the free e-newsletter, you may do so here (we will never share your e-mail with anyone, just as we don't accept advertising).
The last Market Outlook (June 16, how time flies) made only two observations regarding the S&P 500:
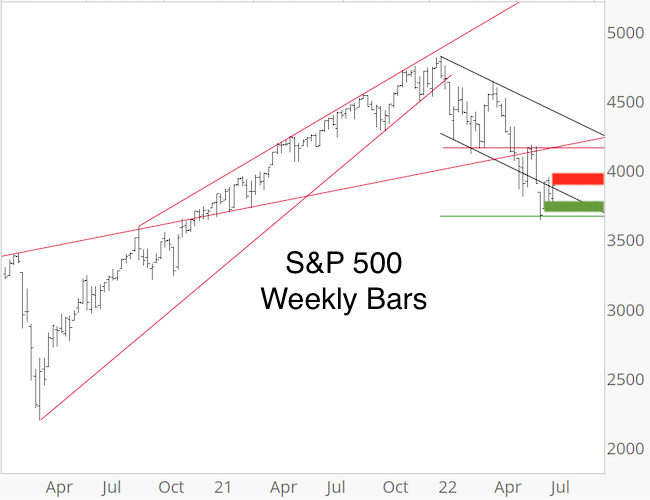
- There's a massive chart gap at 3,900, which certainly will be closed.
- There's support at 3,600 - 3,300, which could be tested.
In addition, the Profit Radar Report highlighted that 3,664 is where a potential S&P 500 C-wave would be a Fibonacci 1.382 x wave A (the most bullish S&P 500 scenario).
Since then, the S&P fell as low as 3,636 and bounced as high as 3,945 (reaching the up and down side 'target' mentioned above).
Investors are emotionally charged and it's easy to get carried away with doomsday or overly optimistic expectations. I too have a bullish and bearish scenario. I favor the bullish scenario, but I'm not married to it.
I wrote in the June 29 Profit Radar Report that: "We will give the market some space to get itself together and wait for either a move above the 3,950 zone (red bar) or below the 3,720 zone (green bar)."
The S&P is still stuck in this zone, and it's 'watch and wait' time as long as it stays stuck.
Now, the more important invalidation level for the most bearish option is not the red zone, it's a different zone, and it must be cleared to take the doomsday option off the table (I've highlighted this level in the Profit Radar Report).
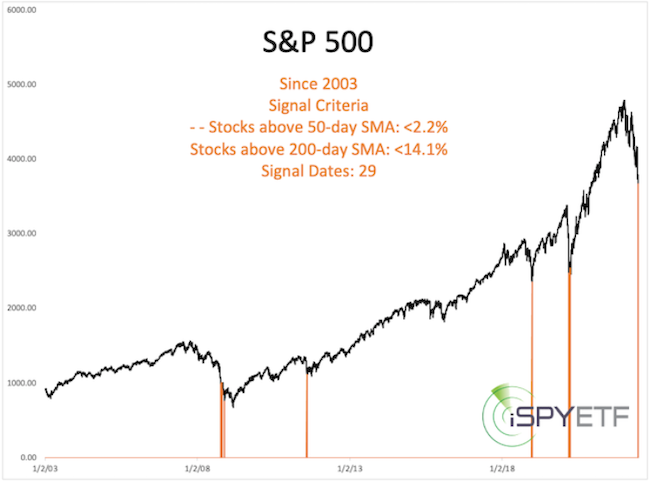
One positive study was featured in the June 19, Profit Radar Report. It showed every time when only 2% (or less) of NYSE-traded stocks closed above their respective 50-day SMA and only 12.8% (or less) above their 200-day SMA. There were 29 signals confined to 5 clusters.
In general, most sentiment and breadth-based studies project at least a short-term bounce while economic indicator-based studies project poor longer-term forward returns.
The best thing to do in a market like this is to look at the facts and don't get carried away by the media's attention grabbing coverage.
On a different note, I mentioned in the June 19 Profit Radar Report than inflation may well take a pause for a couple of months.
Since then, prime 'inflation trades' (assets that have benefit from inflation fears) have taken major haircuts.
EWZ (Brazil ETF), DBA (agriculture ETF), UNG (natural gas ETF) have suffered heavy double digit losses, gold and silver were summoned for a meeting behind the wood shed and even king oil is down. Many of those assets are over-sold, potentially ready for a bounce.
Continued updates and comprehensive, fact-based, out-of-the box analysis (and the invalidation level for the S&P 500 doomsday scenario) are available via the Profit Radar Report.
The Profit Radar Report comes with a 30-day money back guarantee, but fair warning: 90% of users stay on beyond 30 days.
Barron's rates iSPYETF a "trader with a good track record," and Investor's Business Daily writes "Simon says and the market is playing along."
|
