Subscribers to iSPYETF’s free e-mail newsletter receive a market outlook, usually once a week. The market outlook below was sent out on February 22, 2024. If you’d like to sign up for the free e-newsletter, you may do so here (we will never share your e-mail with anyone, just as we don't accept advertising).
The S&P 500 is about to record the 12th all-time high in 2024, one of the best starts to a year ever.
This is a good time for a reality check. Many of the folks cheering higher prices now, were calling for a crash just a few months ago.
You may remember headlines like the following, most of them published around October, 2023, when the S&P was trading in the low 4,000s:
- Stock Market Crash Ahead - Forbes
- Huge Market Crash Coming - Markets Insider
- Top Strategist sees Echoes of 1987 Crash in Today’s Stock Market - Fortune
- S&P 500 Could Crash 27% as US tips into Recession - Business Insider
- Magnificent Seven Stocks Starting to Resemble ‘Nifty 50’ that got Crushed in 1970s Market Crash - MarketWatch
- Expert Says S&P 500 Ripe for Steep Drop up to 63% - Business Insider
- Legendary Investor Jeremy Grantham Says Stock Market has a 70% Chance of Crashing - Fortune
- This Fund Manager is Holding 60% Cash - and Expecting a Stock Market Crash - MarketWatch
- US Economist Predicts 2024 Will Bring Biggest Crash of Our Lifetime - Fox Business
- Shocking Parallels Between S&P 500 and 1929 Stock Market Crash - Finbold
- How Likely is a 1987-Style Stock-Market Crash Today? Likelier than You’d Think - MarketWatch
Hard to believe that many of those headlines are less than 5 months old.
In contrast to those headlines, you can read any of my Free Market Outlook Updates published over the past 6 months (or 18 months) - and available for review on iSPYETF.com - and you will find the same underlying message in each one of them: Stocks will rally strongly once the correction is complete.
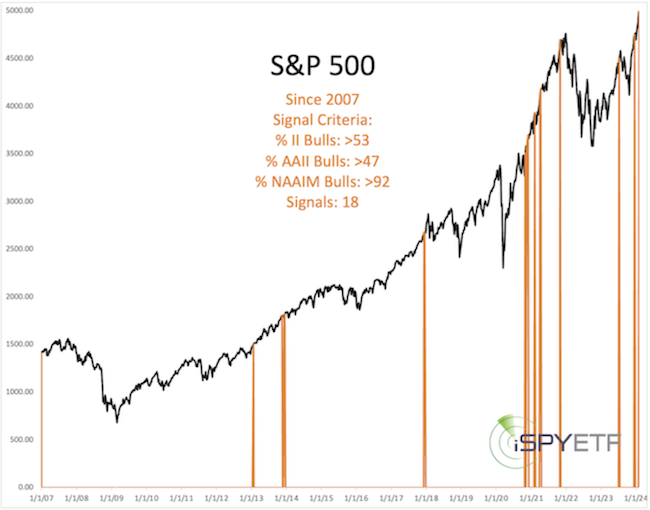
The pendulum has now swung from bearish to bullish sentiment, and some pundits claim there’s now too much bullishness for stocks to continue higher. Commonly quoted sources of excessive bullishness are the Investors Intelligence survey of newsletter writers and other weekly polls.
That too much bullishness is bad for stocks sounds right from a contrarian point of view, but I wanted to see what the actual data says.
The chart below, published in the February 11, 2024 Profit Radar Report, highlights every time when the percentage of bullish investors (polled by II, AAII, NAAIM) was similar or greater than right now.
There were 17 other signals (since 2007). Do you see strong evidence that stocks are doomed to decline based on investor sentiment? I don't, at least not based on sentiment.
Short-term Outlook
Although investor sentiment is not a valid concern, market breadth started to deteriorate in February, raising some yellow flags.
Here is how yellow flags should be viewed (February 7, 2024 Profit Radar Report):
“We are seeing some conditions that come with increased odds of a pullback. But conditions are not signals, so we’ll allow those conditions to go on (and price to go up) until they matter. For the S&P 500, price can continue to at least 5,020 as long is it stays above 4,910.”
In other words, a yellow flag is not an automatic sell signal. It's best to allow the conditions that cause a yellow flag to continue as long as price stays above technical support, in this case 4,910.
The S&P fell as low as 4,920, but stayed above 4,910, which keeps the up trend in tact.
In terms of Elliott Wave structure, this is what I published as most likely path in the January 10, 2024 Profit Radar Report.
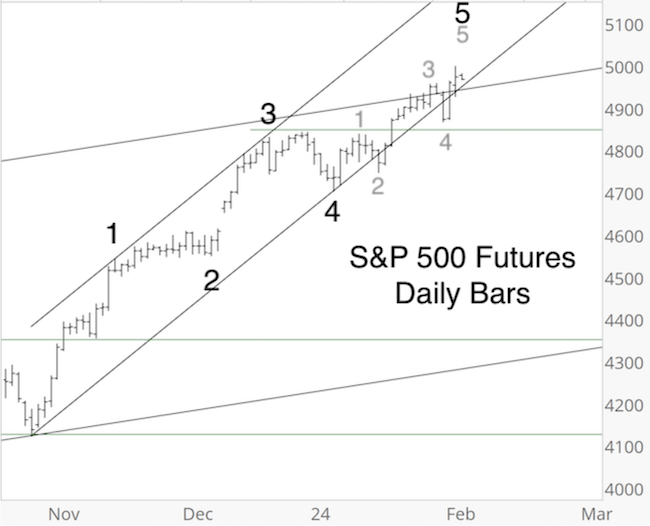
The path continues to play out reasonably well and there is no need to adjust. This structure, if indeed in play, is nearing maturity and S&P 500 Fibonacci resistance around 5,115 is worth watching as potential inflection zone.
How this 5-wave structure fits into the larger picture is discussed in the 2024 S&P 500 Forecast.
To access the 2024 S&P 500 Forecast and purely fact-based analysis, test drive the Profit Radar Report now and become the best-informed investor you know.
The Profit Radar Report comes with a 30-day money back guarantee, but fair warning: 90% of users stay on beyond 30 days.
Barron's rates iSPYETF a "trader with a good track record," and Investor's Business Daily writes "Simon says and the market is playing along."
|
