Subscribers to iSPYETF’s free e-mail newsletter receive a market outlook, usually once a week. The market outlook below was sent out on May 2, 2024. If you’d like to sign up for the free e-newsletter, you may do so here (we will never share your e-mail with anyone, just as we don't accept advertising).
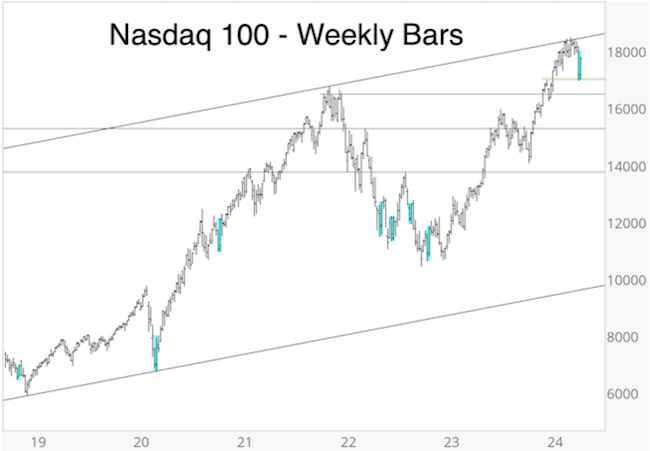
Volatility is back ... kind of. Last week, the Nasdaq-100 was up 4% after being down 5.36%. Over the past 6 years, the Nasdaq-100 has dropped and subsequently popped 4% or more 8 other times. The blue boxes below highlight those times (they weren't a particularly good or bad omen).
Thus far, the scope of the recent correction is in line with my expectations expressed in the April 10 Profit Radar Report:
"The S&P 500 is on the verge of entering a correction. The 'ideal scenario' would be a choppy 5-10% correction."
The April 14 Profit Radar Report expanded a bit further on what I'd like to see:
"Ideally we would like to see several more weeks of a choppy correction with ultimately lower down side targets. Hopefully we will get lower prices and some low-risk entries sometime in May."
I'll be the first to admit that the pattern of the decline from the high is messy, but that too is 'normal' considering that the S&P 500 may be in a larger scale wave 4 diagonal (waves 4 are usually choppy and hard to predict).
Because of the inherent uncertainty that's to be expected in this situation, I've refrained from trying to forecast what will happen and instead outlined what ideally should happen.
If the S&P 500 follows the ideal projection reasonably well, confidence increases that we are on the right path. That path leads to an eventual buying opportunity.
At this point, the S&P 500 is still above the ideal down side target, but I will be starting to look for tell-tale signs of a potential low.
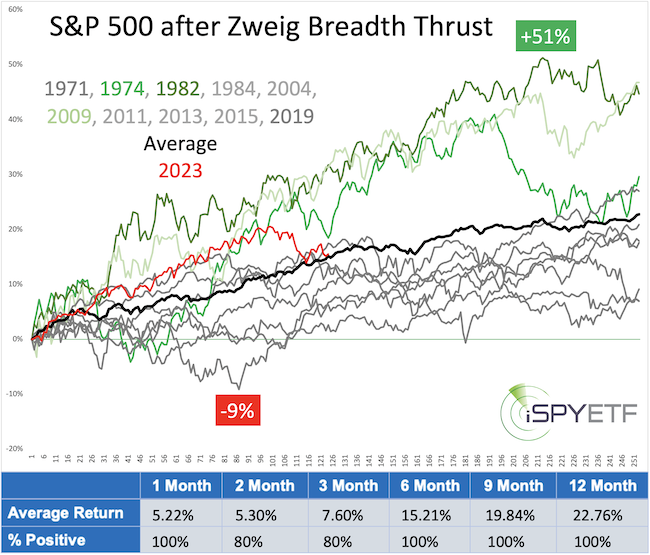
Back in November 2023, and many times since, I've pointed to the Zweig Breadth Thrust and its bullish implications. The chart below compares, once more, how the November 2023 buy signal (red graph) compares to others. Even the best historic signals (1974 & 1982 - graphs in green) took a breather after about 5 months.
And of course, it's important to mention that two major US indexes show open chart gaps at higher prices. My subscribers know the value of chart gaps as they have told us for over a decade to continue expecting new all-time highs.
A word of caution: Stocks rallied stronger and longer than they 'should have.' Therefore it is possible the pendulum will swing to the other extreme. The market could deliver a wicked selloff to wash out the weak hands.
To sum up: The question is not if investors should buy, but when and where they should buy.
The Profit Radar Report will attempt to identify the next buying opportunity. Test drive it now and become the best-informed investor you know.
The Profit Radar Report comes with a 30-day money back guarantee, but fair warning: 90% of users stay on beyond 30 days.
Barron's rates iSPYETF a "trader with a good track record," and Investor's Business Daily writes "Simon says and the market is playing along."
|
