In response to the relentless Q4 2019 rally in stocks, I created the Risk/Reward Heat Map (RRHM) to objectively asses upcoming risk (and reward) based on literally hundreds of indicators and historic precedents. RRHM methodology is explained here.
Below is the very first RRHM, published in the December 25, 2019 Profit Radar Report:
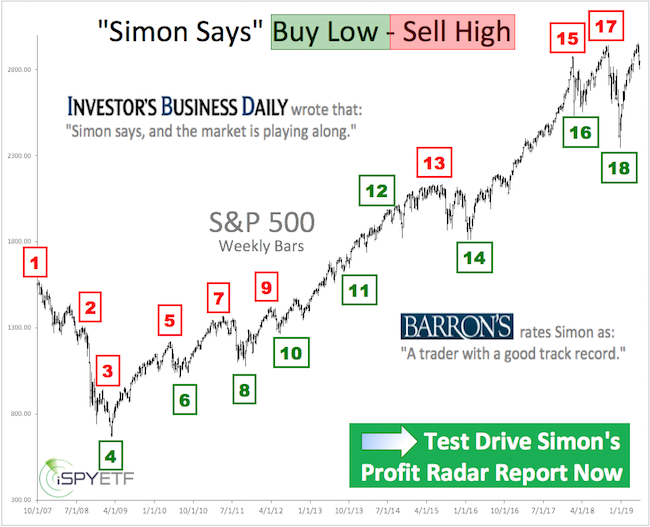
Barron's rates iSPYETF as "trader with a good track record" and Investor's Business Daily says: "When Simon says, the market listens." Find out why Barron's and IBD endorse Simon Maierhofer's Profit Radar Report.
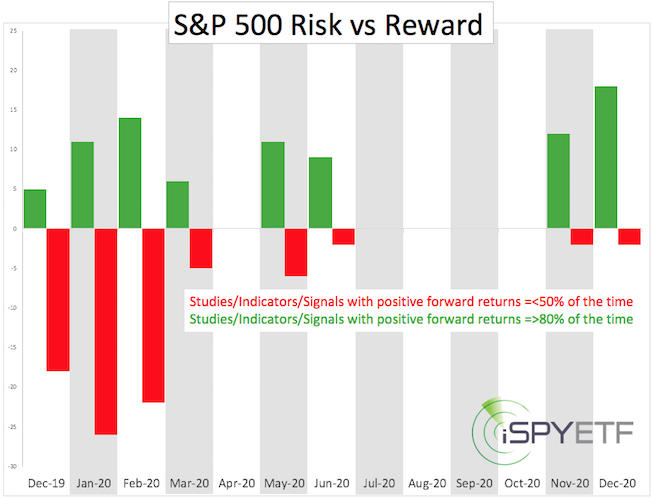
The red bars projected significant risk, and the market delivered much more risk then even anticipated by the RRHM.
In fact, the market decline is unlike any other we've seen before. Below is an excerpt from the March 10 Profit Radar Report, which puts the recent panic into context.
If you enjoy quality, hand-crafted research, >> sign up for the FREE iSPYETF e-newsletter & market outlook
* * * * * March 10, 2020 Profit Radar Report * * * * *
97.70% of NYSE-traded stocks ended down yesterday, the 2nd worst 90%+ down day since 1970. Below is the comple list of 95%+ down days:
-
08/08/2011: 98.73%
-
03/09/2020: 97.70%
-
10/19/1987: 95.98%
-
10/09/1979: 95.56%
-
08/04/2011: 95.56%
-
09/29/2008: 95.11%
-
08/24/2015: 95.05%
Chart #1 outlines the above dates in ‘big picture’ context (dashed blue lines).
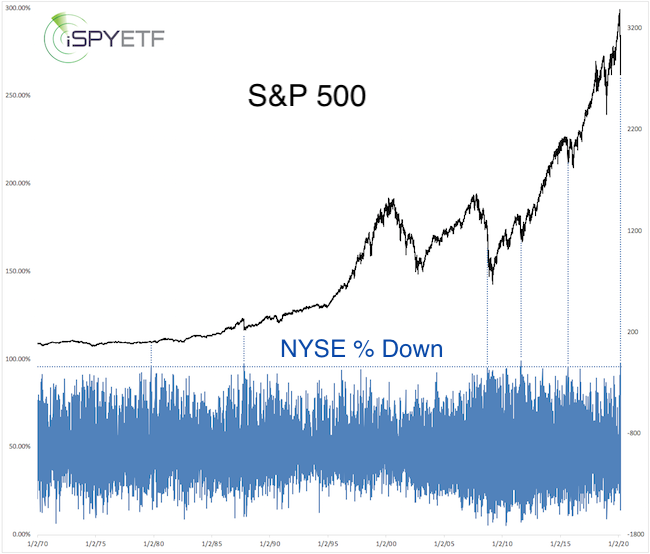
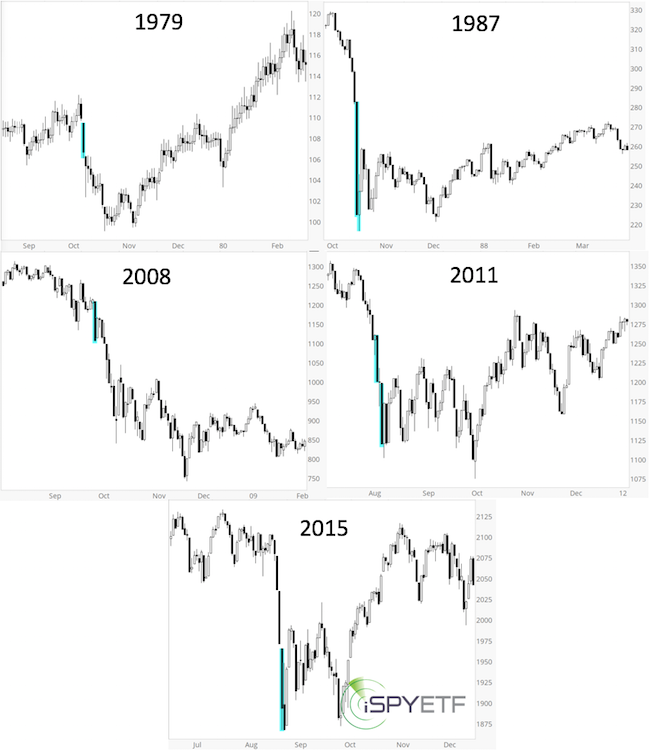
Chart #2 provides thumbnail performance for each instance (highlighted in blue). There were two 95%+ days in 2011.
53.04% of NYSE-traded stocks closed at 52-week lows yesterday. Since 1970, there have only been 10 other days where more than half of all stocks sat at 52-week lows (5 of them in 2008).
Chart #3 shows those instances in ‘big picture’ context (dashed blue lines).
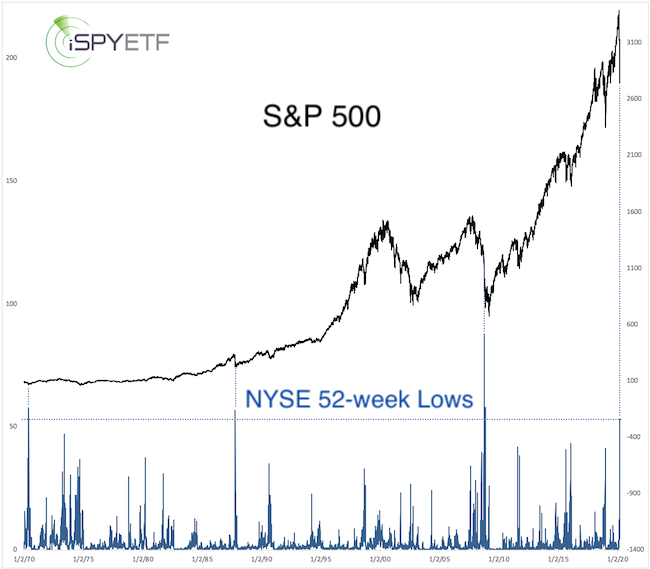
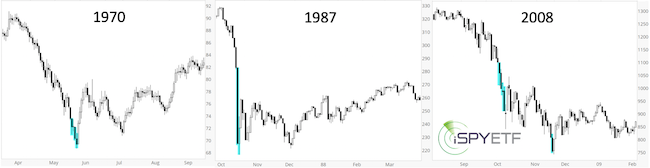
Chart #4 provides thumbnail performance for each instance (highlighted in blue). There were 5 instances in 2008, 3 in 1970, and 2 in 1987. 50%+ lows have come in clusters, does this mean we should expect another 50%+ reading before this correction is over?
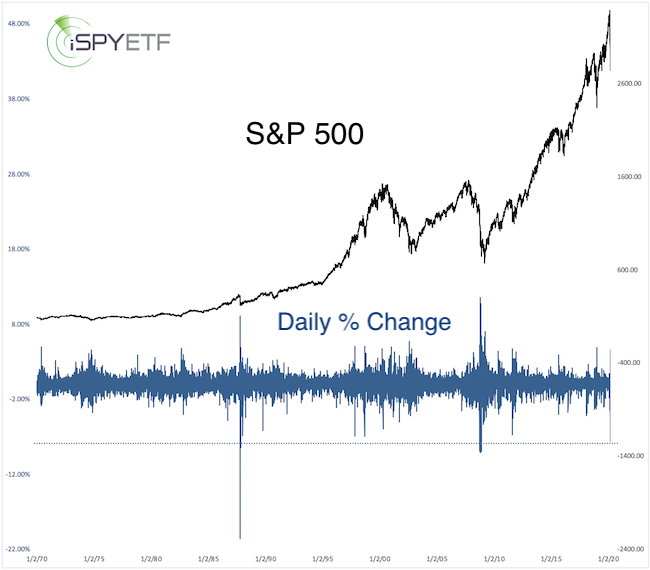
The S&P 500 lost 7.60% yesterday, it’s 8th biggest daily loss since 1970.
Chart # 5 below provides big picture context for the biggest daily % losses.
The more extremes this market delivers, the smaller the list of precedents becomes. 2008 and 1987 are two of the few time periods that come up fairly consistent in our list of precedents.
The 1 - 3 month forward performance for the above studies was positive 55-75% of the time. If we were to exclude the 2008 instances, the forward performance would turn positive 90%+ of the time.
1987 was a brief but nasty ‘rip the bandage off’ type of a decline.
2008 was a long and persistent decline that plowed past the initial extremes seen.
Despite today’s strong gains, it doesn’t look like more than 80% of NYSE-traded stocks closed higher. NYSE-up volume, on the other hand, may have delivered a small breadth thrust (we’ll determine tomorrow after final numbers are in).
The S&P 500 bounced from support around 2,740, but was not able to overcome resistance around 2,860. Based on the cluster of 50%+ NYSE low days in the past, it would not be a first to see another 50%+ NYSE low day.
* * * * * END - March 10, 2020 Profit Radar Report * * * * *
Today may deliver another 50%+ down day, which may spark a sizable rally. Long-term trend line support for the S&P 500 is just below 2,500.
Continued updates, projections, buy/sell recommendations are available via the Profit Radar Report.
Simon Maierhofer is the founder of iSPYETF and the publisher of the Profit Radar Report. Barron's rated iSPYETF as a "trader with a good track record" (click here for Barron's evaluation of the Profit Radar Report). The Profit Radar Report presents complex market analysis (S&P 500, Dow Jones, gold, silver, euro and bonds) in an easy format. Technical analysis, sentiment indicators, seasonal patterns and common sense are all wrapped up into two or more easy-to-read weekly updates. All Profit Radar Report recommendations resulted in a 59.51% net gain in 2013, 17.59% in 2014, 24.52% in 2015, 52.26% in 2016, and 23.39% in 2017.
|