Subscribers to iSPYETF’s free e-mail newsletter receive a market outlook, usually once a week. The market outlook below was sent out on October 26, 2023. If you’d like to sign up for the free e-newsletter, you may do so here (we will never share your e-mail with anyone, just as we don't accept advertising).
To be honest, I got a little more than I bargained for when I wrote the following in the August 2, Profit Radar Report:
“As mentioned in Sunday’s update, the setup for a S&P 500 correction was there. I am hoping stocks will drop further. A move into the 4,300s is easily possible for the S&P without causing any major technical damage.”
The S&P is now below 4,300 and it’s approaching “technical damage” territory. If price doesn’t recover soon, risk of a wash-out decline increases.
Technical damage means different things to different people, and rightfully so (there are usually different technical patterns in play).
Via the July 23 Profit Radar Report, I outlined why a correction was likely. That correction was either going to be:
1) Rather shallow and only bearish for a few months or
2) Deep and longer-term bearish.
These two options were covered again in the last free Market Outlook, S&P 500 Update, Great News and Bad News. If you take a moment to review the above update, it will put the recent decline into longer-term context.
So, "technical damage" means that the S&P 500 is nearing the zone where scenario 1) is becoming less likely (based on Elliott Wave Theory).
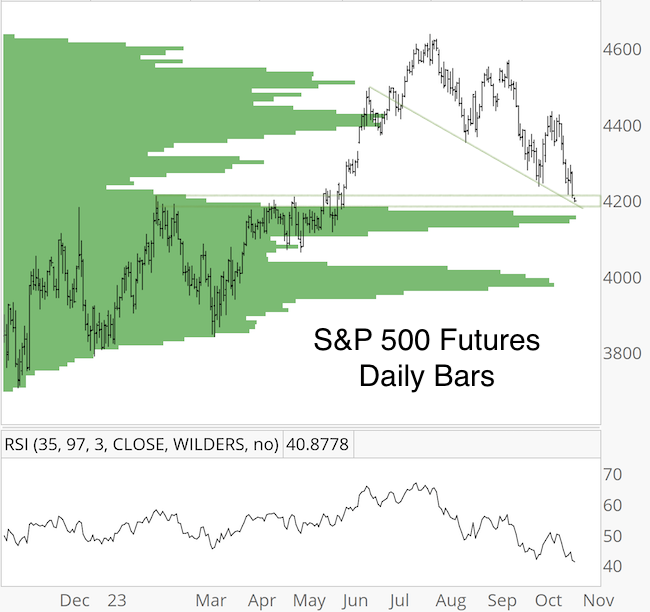
S&P 500 Futures paint a similar picture, but offer one more line of support. The green bars reflect volume by price. Most investors are used to looking at daily volume action, but looking at which price levels have been most heavily traded over the past year provides an interesting take on support.
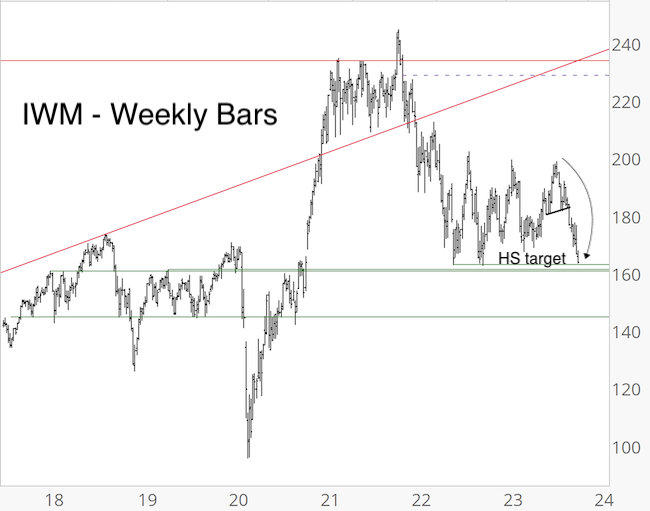
Similar to the S&P 500, small cap stocks represented by IWM are nearing an important zone, important for a number of reasons:
1) The September 20, PRR stated: “IWM broke below support around 182 and the neckline. RSI-35 is trading heavy as well. Based on a nearly over-sold RSI-2, a bounce to re-test the neckline is possible, but unless price closes back above 183, the trend for IWM is seen to be down with a test of the 160s possible.”
2) As the weekly chart shows significant support provided by various previous highs.
IWM is now in the low 160s and reached my down side target. However, a break below 160 could lead to another 10% loss.
Although the potential for technical damage has increased, don't put the cart before the horse. This time of year is a seasonally strong period, and the more negative the media and investors get, the higher the odds of a bounce will become.
I could share many more charts and data points, but here's everything distilled into one sentence: As long as the S&P 500 stays below resistance, we have to allow for more down side (this is essentially the same as shared in the last Market Outlook: "since RSI-35 confirmed today’s low, I am actually anticipating overall lower prices as long as the S&P cannot close back above 4,450.").
For continued updates, purely fact based research, and objective analysis, sign up for the Profit Radar Report.
The Profit Radar Report comes with a 30-day money back guarantee, but fair warning: 90% of users stay on beyond 30 days.
Barron's rates iSPYETF a "trader with a good track record," and Investor's Business Daily writes "Simon says and the market is playing along."
|
