Subscribers to iSPYETF’s free e-mail newsletter receive a market outlook, usually once a week. The market outlook below was sent out on November 30, 2023. If you’d like to sign up for the free e-newsletter, you may do so here (we will never share your e-mail with anyone, just as we don't accept advertising).
This is by far the most reliable chart pattern I’ve ever encountered. It is still widely unknown and highly effective. In fact, it struck again last week and confirmed its 100% track record of accuracy.
I’ve covered the pattnern in these pages many times in the past and called it ‘rally guarantee’ in the June 1, 2023 free Market Outlook.
The last time this chart pattern unfolded, I only wrote about it in the Profit Radar Report (my apologies to the readers of the free Market Outlook). It actually happened twice in H2 2023: On August 2, and September 21. What is this so reliable pattern? Chart gaps.
Why do the matter? Because all down side chart gaps over the past 15+ years have been filled.
The purple lines highlight the August 2 and September 21 chart gaps.
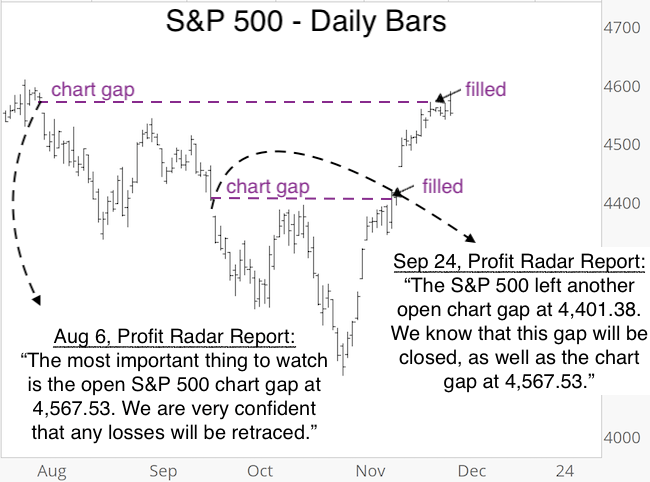
Below are the corresponding comments in the subsequent Profit Radar Report updates:
August 6, Profit Radar Report: “The most important thing to watch, at this point, is the open S&P 500 chart gap at 4,567.53. As long as it remains open (and we hope it does), we are very confident that any losses (and we hope we’ll see more) will be retraced and there will be an eventual buying opportunity.”
September 24, PRR: “S&P 500 also left another open chart gap at 4,401.38. We know (with as much certainty as possible when it comes to market analysis) that this gap at 4,401.38 will be closed, as well as the chart gap at 4,567.53.”
As the chart above shows, the September 21 gap at 4,401.38 was closed on November 10. The August 2 gap at 4,567.53 was closed on November 22.
Elliott Wave Theory update
It’s time to update the Elliott Wave Theory (EWT) scenario first discussed in the July 23, Profit Radar Report (also covered in the free Market Outlook here and here):
The July 23, Profit Radar Report warned that: “The Elliott Wave Theory (EWT) structure is at a point where a pullback is becoming more likely. Shown in the chart below is the most bearish version, but the advance could also be 1, 2, 3 instead of A, B, C. An upcoming decline could be a more shallow wave 4 or severe wave C (red). Based on the Risk/Reward Heat Map, the bearish version is very unlikely, but not impossible."
Shown below is the original July 23 chart (left) and updated chart (right).
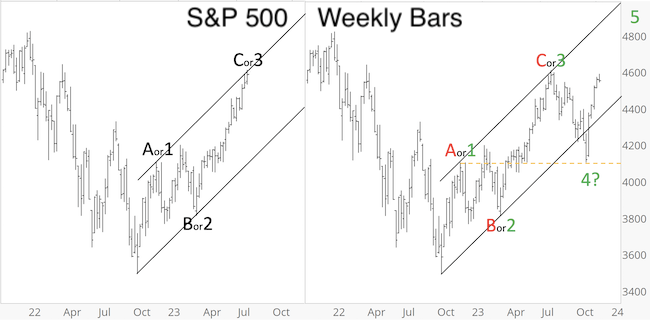
As anticipated, the S&P 500 pulled back after touching the trend channel at the wave C or 3 location.
One of the cardinal EWT rules is that waves 1 and 4 are not allowed to overlap (click here for more details on EWT). The overlap level is indicated by the dashed orange line. This bearish overlap was only narrowly avoided.
While the pullback warning near the July high was fairly straight-forward, the pattern since then is not. Technically the S&P could still rally to carve out wave 5. Since the overlap was avoided by only 2.28 points (0.07%) and because other indexes sport entirely different patterns, I recommend against hitching ones invest decisions to EWT. Don't get me wrong, I'm not saying bullish options are not possible, they very much are, I just caution against using EWT to validate them.
Courtesy of the rally from the October low, a breadth thrust signal triggered. On average, this signal is seen only once every 4 years, and it has correctly predicted the market's direction every time since 1971 for the ensuing 6, 9 and 12 months.
This breadth thrust signal provides not only a blue print of what’s ‘supposed to’ happen, it also provides a ‘this time is different’ warning level.
The details of this breadth thrust and whether the massive chart gaps left open by the rally from the October low need to get filled are available via the Profit Radar Report.
The Profit Radar Report comes with a 30-day money back guarantee, but fair warning: 90% of users stay on beyond 30 days.
Barron's rates iSPYETF a "trader with a good track record," and Investor's Business Daily writes "Simon says and the market is playing along.
|
