My worst fear when I first started analyzing markets and publishing my research was FOMO. Fear Of Missing Out … on the next big move.
This was reflected in my market forecasts, which were either full speed forward (prices will soar) or full speed reverse (market will crash).
True, this kind of mentality helped me peg the 2007 top, and the March 2009 and October 2011 bottoms, but it takes more than an ‘all or nothing’ approach to succeed at investing.
Today I rely on dozens of indicators that fall into one of four categories: 1) Supply & demand 2) Technical Analysis 3) Investor Sentiment 4) Seasonality & Cycles.
Barron's rates the iSPYETF as a "trader with a good track record." Click here for Barron's assessment of the Profit Radar Report.
The result is a more balanced, comprehensive and potent signal, along with the realization that the market may be stuck in neutral for a while.
There are times when indicators conflict and essentially cancel each other out. More often than not, trading during such times is like forcing the round peg through the proverbial square hole.
On Wednesday, May 4, the S&P 500 dropped to 2,046, which was also the March 17 high. In essence, the S&P 500 hasn’t gone anywhere for the last 33 trading days.
Looking back, it now makes sense why our indicators haven’t given us a S&P 500 signal (and why the Profit Radar Report hasn’t recommended a S&P 500 trade) since March 17 (when we closed out the S&P 500 position bought at 1,828).
Not Laziness, but Patience
It’s almost been a month since the last complimentary S&P 500 update (April 11: S&P 500 Stuck in Resistance Mud). It’s not because I’ve gotten lazy, but there just hasn’t been much to update.
The concluding comment of the last April 11 S&P update was that: “Our indicators stopped providing a cohesive directional signal when the S&P first hit 2,040. In hindsight, this explains the trading range since. Unfortunately, there is still no cohesive directional signal.
This is a 'one cookie now, or two cookies later' market where patience tends to be rewarded. More often than not, this means it’s best to sit on the sidelines. We will consider buying at lower prices or (short) selling at higher prices.”
If you enjoy quality, hand-crafted research, >> Sign up for the FREE iSPYETF Newsletter
S&P 500 Projection
Based on what signals we had to work with, the April 13 Profit Radar Report featured the following projection along with this comment:
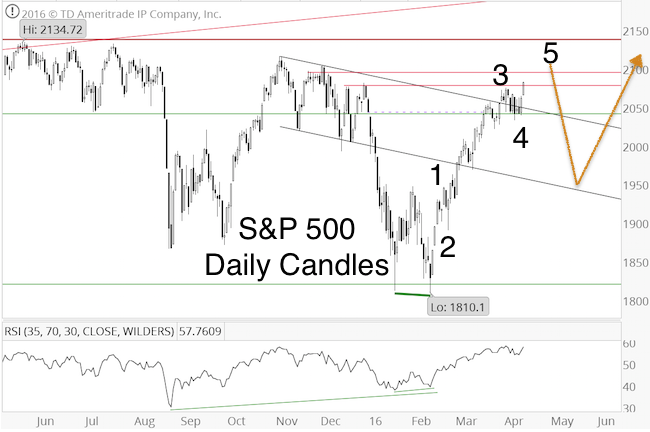
“Support at 2,040 held and the S&P 500 moved higher today. Looks like the short-term bullish wave 4/wave 5 scenario discussed on Sunday is in play. This means, that the S&P 500 is likely to continue a bit higher, before embarking upon a deeper (but temporary) correction.
The Elliott Wave Theory labels along with its implications (yellow lines) are drawn on the daily chart. A move to 2,100 - 2,115 would make the chart look more 'proportional.' Unless all the bearish divergences are erased, we anticipate a promising setup to go short around 2,100 - 2,115.”
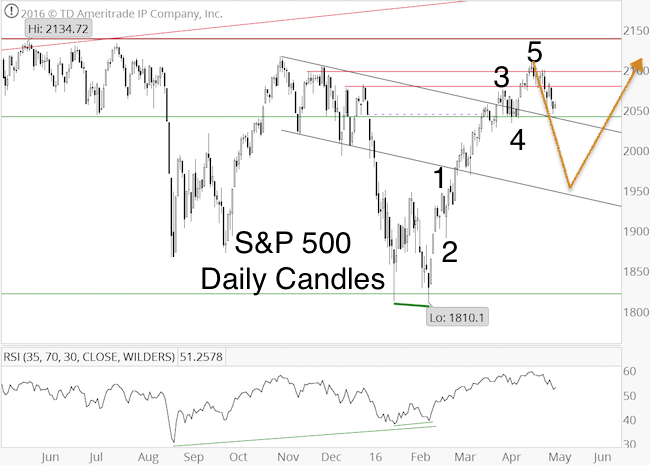
Thus far, the S&P topped and reversed at 2,111.05 on April 20. It is possible that the S&P is following the projected yellow path.
However, there is support around 2,040, and another rally to new recovery highs before a deeper correction is possible. With or without another rally, we are nearing a deeper correction ... and a potential 'two cookie reward.'
Continued S&P 500 analysis is available via the Profit Radar Report.
Simon Maierhofer is the founder of iSPYETF and the publisher of the Profit Radar Report. Barron's rated iSPYETF as a "trader with a good track record" (click here for Barron's profile of the Profit Radar Report). The Profit Radar Report presents complex market analysis (S&P 500, Dow Jones, gold, silver, euro and bonds) in an easy format. Technical analysis, sentiment indicators, seasonal patterns and common sense are all wrapped up into two or more easy-to-read weekly updates. All Profit Radar Report recommendations resulted in a 59.51% net gain in 2013, 17.59% in 2014, and 24.52% in 2015.
Follow Simon on Twitter @ iSPYETF or sign up for the FREE iSPYETF Newsletter to get actionable ETF trade ideas delivered for free.

If you enjoy quality, hand-crafted research, >> Sign up for the FREE iSPYETF Newsletter
|
