Subscribers to iSPYETF’s free e-mail newsletter receive a market outlook, usually once a week. The market outlook below was sent out on September 16. If you’d like to sign up for the free e-newsletter, you may do so here (we will never share your e-mail with anyone, just as we don't accept advertising).
This is the S&P 500 Futures chart we've been looking at. The September 6, Profit Radar Report stated that: "Initial support is at 4,510 and a break below will increase short-term risk."
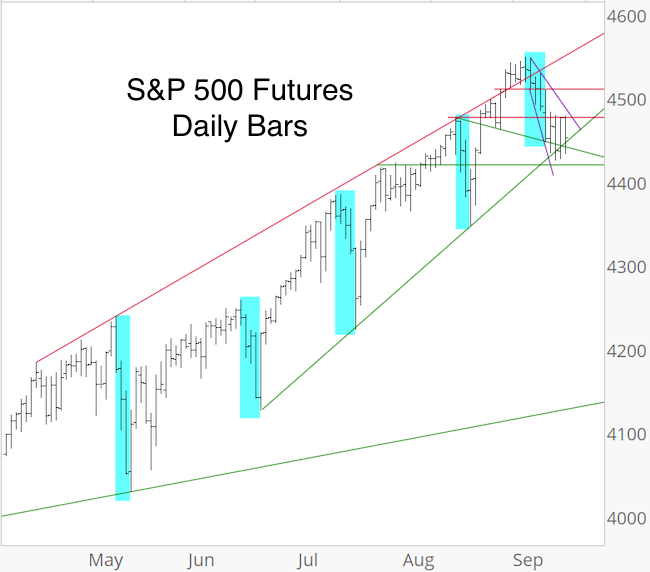
The S&P has drifted lower since falling below 4,510 and, unlike all other pullbacks since April (blue boxes), the S&P has not bounced right back. Perhaps this means that the character of this rally has changed. Next support is in the low 4,400s. A sustained break below would further increase risk.
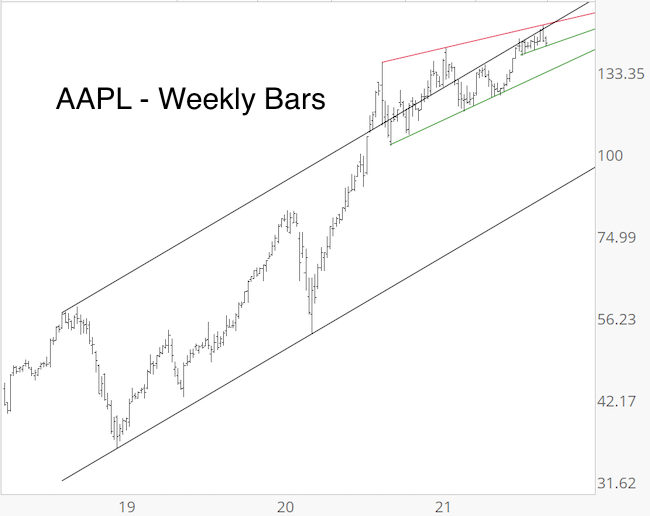
AAPL peeled away from double resistance, and the decline from last week's high looks like 5 waves, which suggests 2 things:
1) a bounce (wave b or 2)
2) followed by a relapse and at least one more leg down (wave c or 3)
Last week's Market Outlook mentioned that August highs tend to make investors cry (if you haven't read it, the full article is available here). Here is another study that suggests to be cautious.
The chart below plots the S&P 500 (red graph, since 12/1/20) against the 10 most similar time periods. For this study we only focus on the average forward performance, which is illustrated by the bold black graph to the right of the dashed red line.
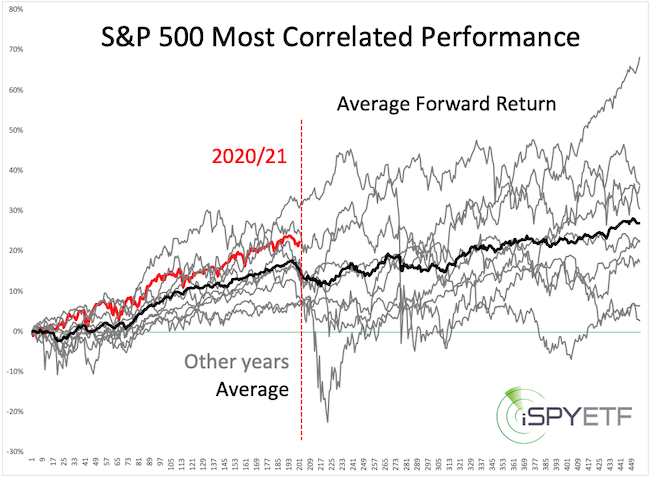
On average, the S&P has hit a rough spot right about now ... and that rough spot can last several months.
The Risk/Reward Heat Map projected risk for September and we are starting to see some of that risk. To kick up the risk level further, the indexes need to stay below resistance for the next few days and start heading south again thereafter (which seems like a real possibility).
Continued updates, out-of-the box analysis and forward performance based on historic precedents are available via the Profit Radar Report.
The Profit Radar Report comes with a 30-day money back guarantee, but fair warning: 90% of users stay on beyond 30 days.
Barron's rates iSPYETF a "trader with a good track record," and Investor's Business Daily writes "Simon says and the market is playing along."
|
