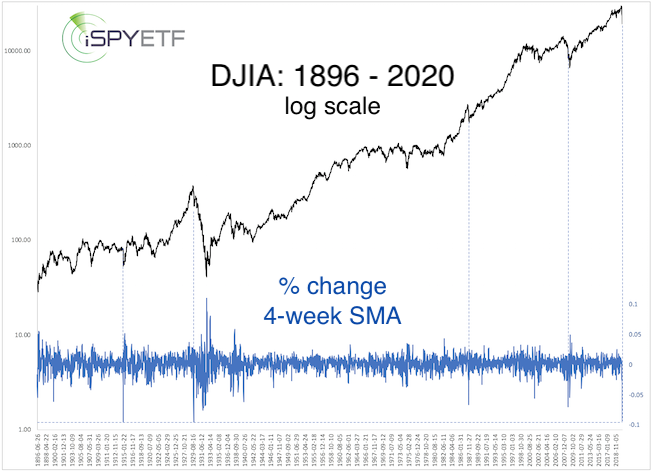
Before we get to the short-term S&P 500 update, here is a big picture look at the Dow Jones, going all the way back to 1896.
As of Friday, March 20, the Dow Jones lost an average of 9.56% every week for the past 4 weeks. The biggest 4-week loss ever. The only 2 times that come close to this losing record are 1914 (WWII) and 1929.
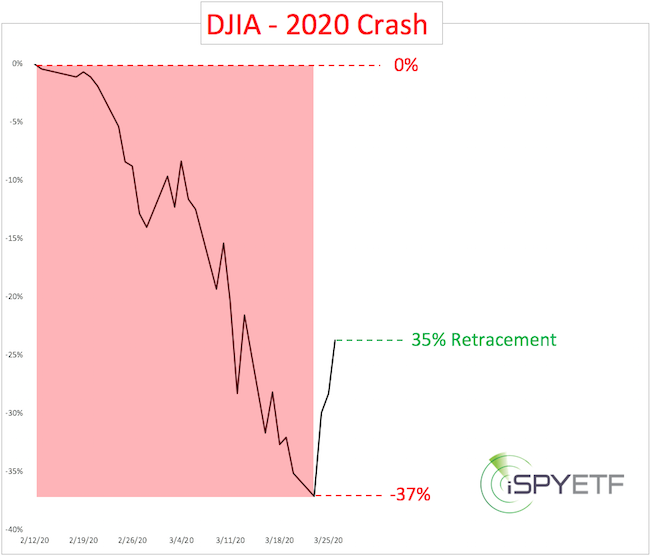
Shorter-term, the Dow Jones retraced 35% of the points lost since its February 12 high.
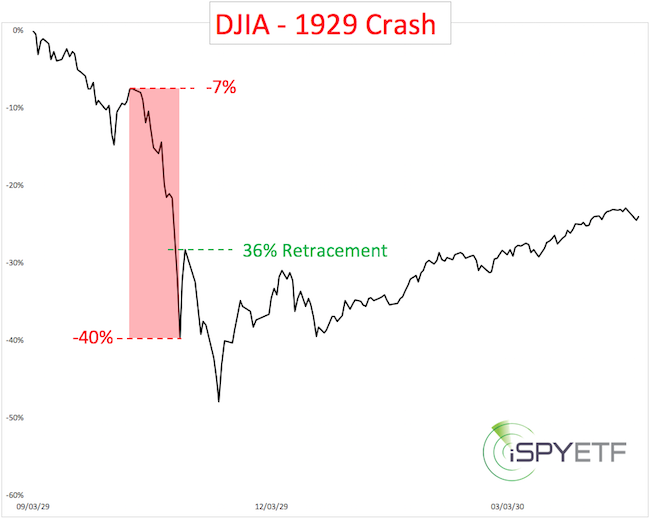
The first real bounce during the 1929 crash phase (red box) retraced 36%, but relapsed once more before delivering a 5-month, 50% bounce.
S&P 500 Update
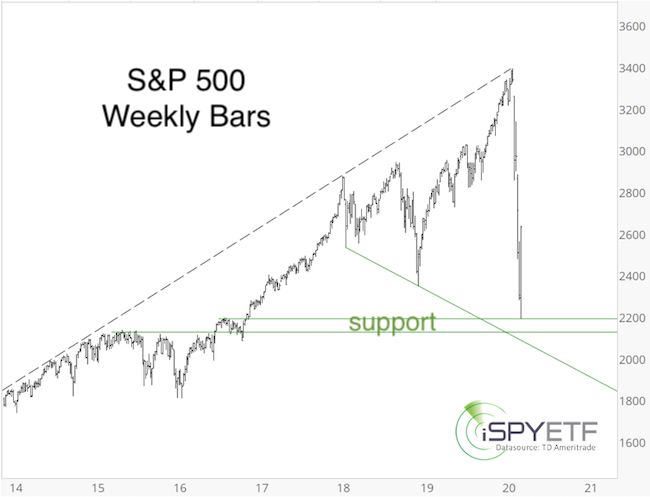
The Sunday March 22 Profit Radar Report featured the chart below and stated that: “It is quite possible that the S&P 500 will jolt higher from the 2,190 - 2,130 range, and aggressive traders may act accordingly.”
Barron's rates iSPYETF as "trader with a good track record" and Investor's Business Daily says: "When Simon says, the market listens." Find out why Barron's and IBD endorse Simon Maierhofer's Profit Radar Report.
On Monday, March 23, the S&P dipped as low as 2,191.86 and soared more than 400 points.
If you enjoy quality, hand-crafted research, sign up for the FREE iSPYETF e-newsletter & market outlook
There was a lot of oomph behind the 400+ point rally as 85.79% of NYSE-traded stocks closed higher for the past 3 days. This is a new record, as the chart below shows, and has been a solid buy signal.
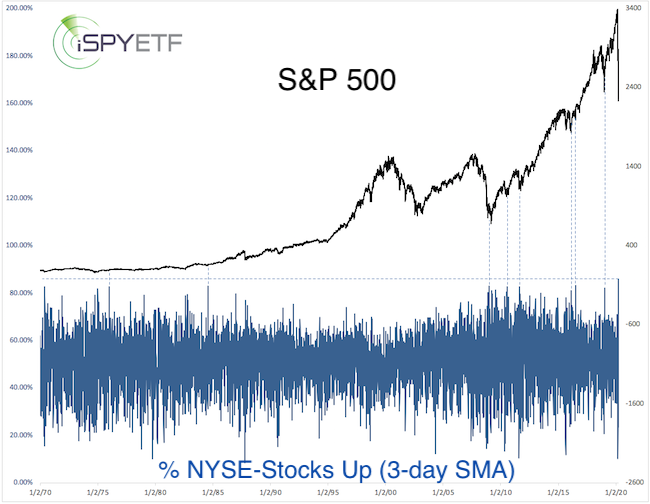
Does this mean the low is in?
The March 24 Profit Radar Report featured the following chart and two Elliott Wave Theory interpretations:
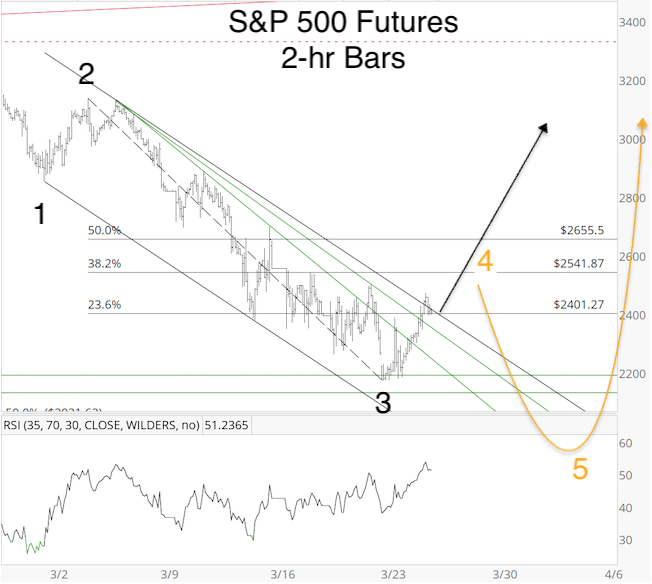
“Black: A 3-wave decline (potentially even 5-wave decline) completed at yesterday’s low. A large rally, possibly even to new highs, is under way.
Yellow: A 3-wave decline completed at yesterday’s low. A wave 4 rally is underway. Waves 4 tend to be very choppy and ultimately retrace around 38.2% of the prior wave 3 (2,542, see Fibonacci ruler), but could also go as far as the 50% level (2,655).”
Short-term, another new low (yellow projection) is still possible, but has become less likely.
Continued updates, projections, buy/sell recommendations are available via the Profit Radar Report.
Simon Maierhofer is the founder of iSPYETF and the publisher of the Profit Radar Report. Barron's rated iSPYETF as a "trader with a good track record" (click here for Barron's evaluation of the Profit Radar Report). The Profit Radar Report presents complex market analysis (S&P 500, Dow Jones, gold, silver, euro and bonds) in an easy format. Technical analysis, sentiment indicators, seasonal patterns and common sense are all wrapped up into two or more easy-to-read weekly updates. All Profit Radar Report recommendations resulted in a 59.51% net gain in 2013, 17.59% in 2014, 24.52% in 2015, 52.26% in 2016, and 23.39% in 2017.
|