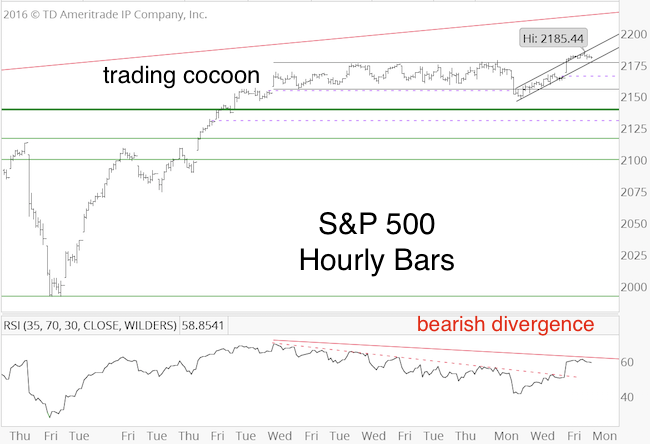
On July 12, the S&P 500 became overbought and has been wrapped in a tight trading cocoon ever since.
In fact, for 13 trading days, the S&P didn’t move more than 22.5 points. That’s one of the tightest trading ranges in history.
The chart below, published in the July 31 Profit Radar Report, highlights similar trading ranges in recent history and concluded the following:
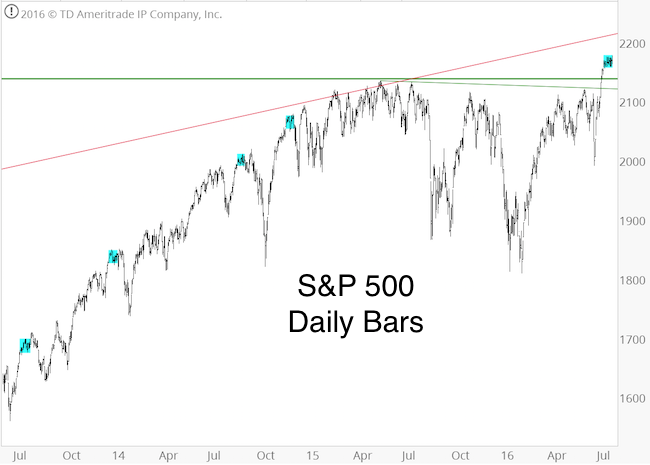
“The blue boxes below highlight the last four similarly tight trading ranges. Each one of them was followed by a pullback, sometimes after a post-trading range spike. This harmonizes with the notion that most trading ranges occur in the position of wave 4 corrections.
On Friday, the S&P eked out another all-time high at 2,177. This could be all of, or the beginning of, the post-trading range spike. A sustained break above 2,176 would unlock the next up side target at 2,190 – 2,220.
The bearish divergences discussed previously persist and suggest that we’ll see an eventually pullback, similar to prior post-range patterns.”
Barron's rates iSPYETF as a "trader with a good track record." Click here for Barron's assessment of the Profit Radar Report.
No Change ... but New Developments
Although the S&P hasn’t gone anywhere for weeks (the last longer-term S&P 500 outlook remains valid), two noteworthy developments happened 'under the hood:'
-
The trading range digested the overbought condition present on July 12.
-
The trading range created bearish divergences.
Unfortunately, these two developments are in conflict with each other. This means we need to be extra alert for curveballs.
If you enjoy quality, hand-crafted research, >> Sign up for the FREE iSPYETF Newsletter
Nevertheless, based on the majority of our indicators, we should see an up/down sequence before the next sustainable rally leg.
Short-term pullbacks should turn out to be longer-term buying opportunities.
Target levels, buy triggers and continued updates are available via the Profit Radar Report.
Simon Maierhofer is the founder of iSPYETF and the publisher of the Profit Radar Report. Barron's rated iSPYETF as a "trader with a good track record" (click here for Barron's profile of the Profit Radar Report). The Profit Radar Report presents complex market analysis (S&P 500, Dow Jones, gold, silver, euro and bonds) in an easy format. Technical analysis, sentiment indicators, seasonal patterns and common sense are all wrapped up into two or more easy-to-read weekly updates. All Profit Radar Report recommendations resulted in a 59.51% net gain in 2013, 17.59% in 2014, and 24.52% in 2015.
Follow Simon on Twitter @ iSPYETF or sign up for the FREE iSPYETF Newsletter to get actionable ETF trade ideas delivered for free.

If you enjoy quality, hand-crafted research, >> Sign up for the FREE iSPYETF Newsletter
|
