A lot has happened the last week or two, and it appears like the S&P 500 has entered the ‘post panic’ stage. Before we discuss the typical ‘post panic’ pattern, here is a brief recap.
On June 9, we went short the S&P 500 at 2,110. This was our insurance trade against lower prices (unlike an actual insurance policy, this trade didn’t cost anything).
On June 19, which was five days before the Brexit vote, the Profit Radar Report was looking for “an early week bounce, followed by a late week sell off,” which is pretty much what happened.
Barron's rates iSPYETF as a "trader with a good track record." Click here for Barron's assessment of the Profit Radar Report.
Somewhere in between the bounce and sell off is an interesting tale about what happened to our short position. This tale is told here.
The question, after the S&P lost 122 points in three days, is: What’s next?
What's Next?
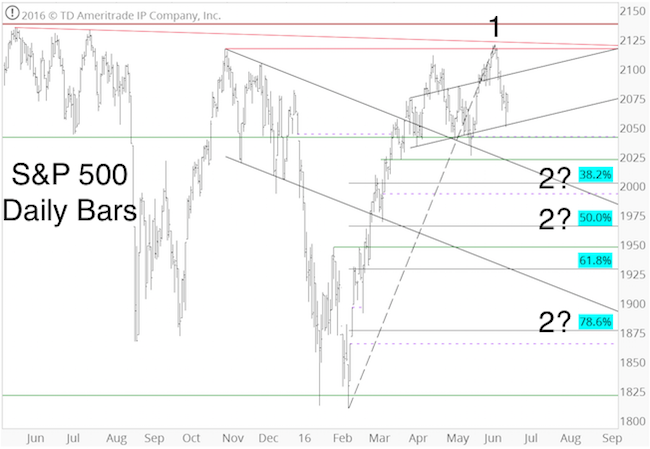
The chart below, initially published by the June 19 Profit Radar Report, along with the following commentary, may have the answer:
“Based on Elliott Wave Theory, the S&P finished 5-waves up to complete wave 1 on June 8 at 2,120.55. Next should be a wave 2 decline. Waves 2 tend to retrace a Fibonacci 50% - 61.8% of the prior move. The ideal target range for a wave 2 correction is 1,970 – 1,925.”

The S&P 500 has not reached the ideal target zone, but odds are decent it will (eventually).
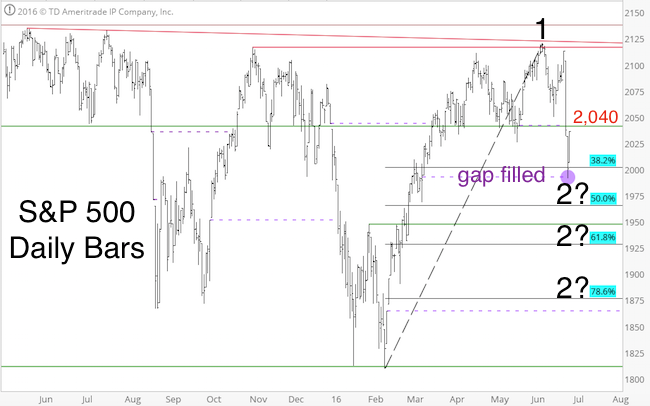
The June 27 Profit Radar Report painted the following picture: “Two separate price patterns suggest a bounce is brewing. Today's decline didn't hit any specific support level, but it closed the open chart gap at 1,992.63. The panic decline is nearing its end. Next should be a choppy bounce.”

It appears like the S&P is now tracing out this ‘choppy bounce.’ Tuesday’s strong surge brought the S&P 500 almost back to 2,040, which was prior support, and is now resistance.
Normally we’d say that a move above 2,040 would unlock further up side (and it probably will), but post panic moves tend to be choppy and unpredictable, likely to seesaw across support/resistance levels.
While the daily price action may become irrational, the Profit Radar Report identified a post panic pattern the S&P adheres to about 7 of 10 times. We discussed this pattern after the initial January panic decline here ... and it ultimately helped us to buy on February 11 at S&P 1,828.
Most indicators thus far suggest this post panic pattern will be one of the 7. The latest Profit Radar Report update outlines this specific pattern. Of course, we never completely rely on any particular patterns, but use our indicators to either confirm or invalidate, and adjust accordingly. Continued updates are available via the Profit Radar Report.
Simon Maierhofer is the founder of iSPYETF and the publisher of the Profit Radar Report. Barron's rated iSPYETF as a "trader with a good track record" (click here for Barron's profile of the Profit Radar Report). The Profit Radar Report presents complex market analysis (S&P 500, Dow Jones, gold, silver, euro and bonds) in an easy format. Technical analysis, sentiment indicators, seasonal patterns and common sense are all wrapped up into two or more easy-to-read weekly updates. All Profit Radar Report recommendations resulted in a 59.51% net gain in 2013, 17.59% in 2014, and 24.52% in 2015.
Follow Simon on Twitter @ iSPYETF or sign up for the FREE iSPYETF Newsletter to get actionable ETF trade ideas delivered for free.

If you enjoy quality, hand-crafted research, >> Sign up for the FREE iSPYETF Newsletter
|