Subscribers to iSPYETF’s free e-mail newsletter receive a market outlook, usually once a week. The market outlook below was sent out on August 25, 2022. If you’d like to sign up for the free e-newsletter, you may do so here (we will never share your e-mail with anyone, just as we don't accept advertising).
The last few Free Market Outlooks discussed why stocks should rally.
Once the rally started, the Profit Radar Report focused on how high stocks will go. The most likely initial target was expanding diagonal trend line resistance, which I first published in the July 31 Profit Radar Report with the following comment:
"The purple lines outline an expanding diagonal (resistance around 4,350). The textbook blueprint for this diagonal would be to tag the purple line and then fall."
Below is an updated version of the July 31 chart.
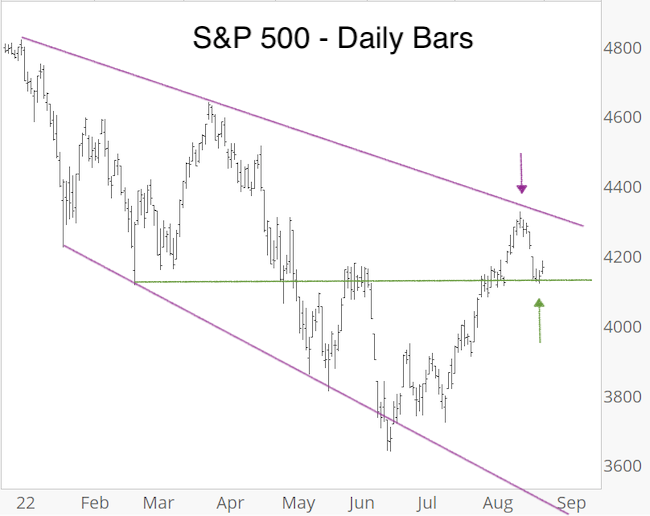
The S&P 500 almost tagged the upper expanding diagonal resistance line on August 16 and retreated. Thus far, support around 4,120 (outlined in the August 17 Profit Radar Report) has held.
Here is the somewhat scary part. The down side target of the expanding diagonal is below 3,636 (new lows).
While the S&P 500 obviously reacted to the trend line, and turned at an inflection zone, I am not convinced the pattern will play out in its entirety (with new lows and all). Why?
The expanding diagonal is one piece of the puzzle, but we always need to look at the big picture and the entire body of evidence (and I look at a ton of evidence).
One interesting fact, for example, is that a little over a week ago over 90% of S&P 500 stocks traded back above their 50-day SMA.
By itself that's nothing unusual, but interestingly the S&P was not able to do that during the entire 2007-09 bear market (see chart below).
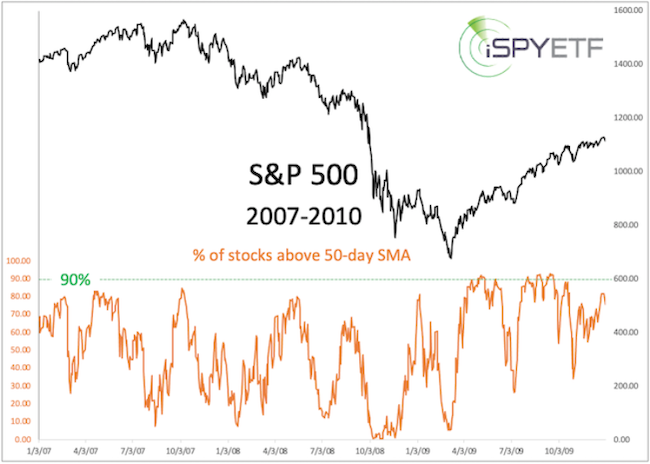
I noticed this when identifying other times when the S&P was more than 10% below its all-time high, but more than 90% of component stocks traded above the 50-day SMA (there were a total of 73 times since 1970). The forward performance after the previous 72 signal dates was very consistent.
Studies like this contribute to the 'weight of evidence,' and I run dozens each month. All of them together are expressed in the Risk/Reward Heat Map.
The Risk/Reward Heat Map, the odds of S&P 500 falling to new lows, and all other fact-based, out-of-the box analysis is available via the Profit Radar Report. Be the best-informed investor you know.
The Profit Radar Report comes with a 30-day money back guarantee, but fair warning: 90% of users stay on beyond 30 days.
Barron's rates iSPYETF a "trader with a good track record," and Investor's Business Daily writes "Simon says and the market is playing along."
|
