Subscribers to iSPYETF’s free e-mail newsletter receive a market outlook, usually once a week. The market outlook below was sent out on September 29, 2022. If you’d like to sign up for the free e-newsletter, you may do so here (we will never share your e-mail with anyone, just as we don't accept advertising).
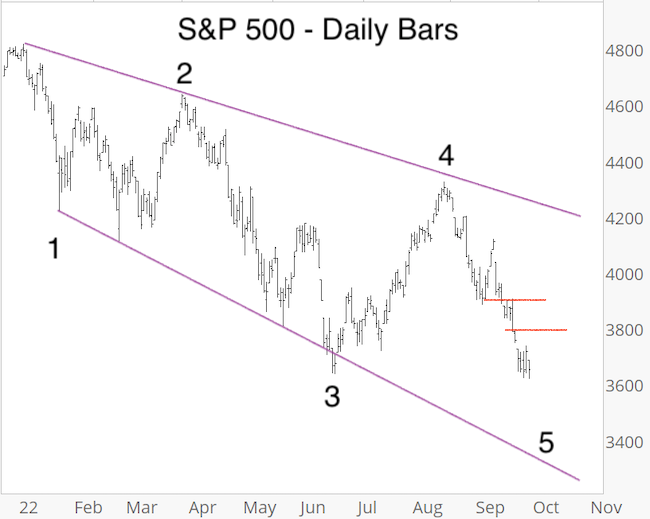
The expanding diagonal pattern, first identified in the July 31 Profit Radar Report, continues to play out. The pattern is outlined via the purple lines below.
This pattern has been a surprisingly simple way to navigate an incredibly complex investing environment (I wrote about this here).
To continuously validate the pattern, I've also provided 'the trend is down as long as' resistance levels, such as the following:
September 18, Profit Radar Report: "Bears have the upper hand as long as the S&P 500 does not sustain trade above 3,920."
September 21, Profit Radar Report: "Trade below 3,790 is another simple 'line in the sand for short-term bearish risk."
The 'the trend is down as long as' resistance levels are shown in red below. Neither of those level has been broken to the up side, so the trend continues down towards an eventual wave 5 low.
It's beautiful when a pattern works out like 'painting by numbers,' but the market never consistently rewards one trick pony analysts.
Just last Sunday, I did a deep dive analysis of market breadth and investor sentiment to see if the weight of evidence supports or contradicts the expanding diagonal pattern.
Being aware of a wide spectrum of indicators prevents tunnel vision and getting blind sighted.
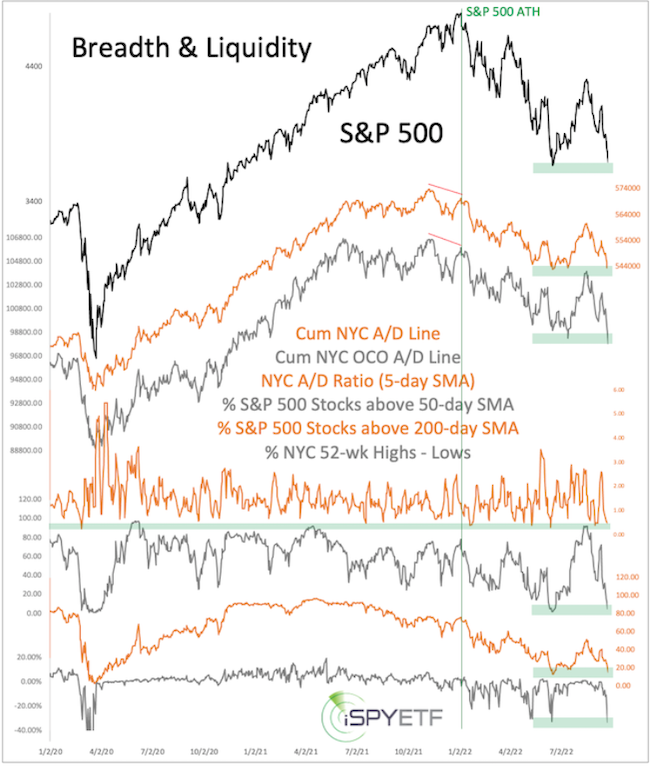
Market breadth
Shown below are 6 different breadth measures. Some of them are near their June lows (like the S&P 500) and others are reaching levels where a reversal to the mean becomes more likely.
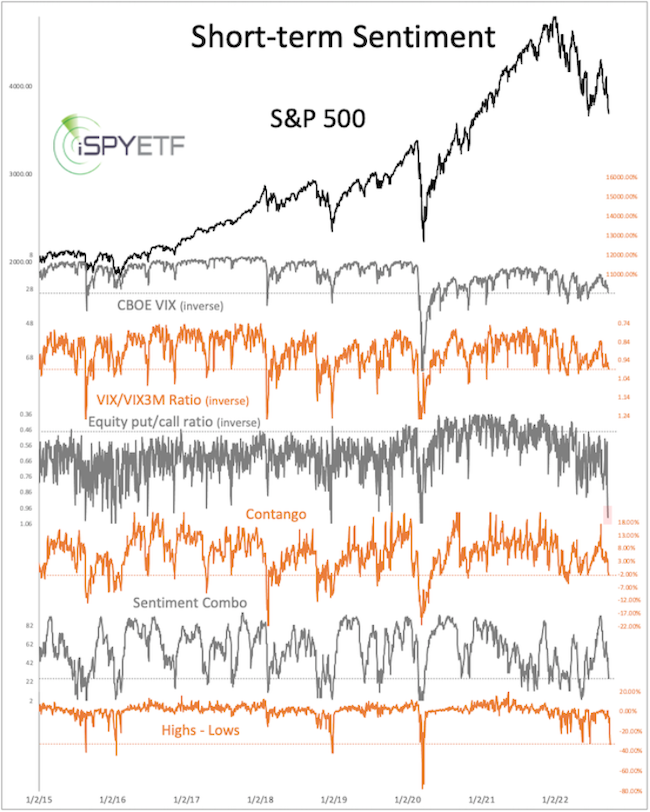
Investor Sentiment
Only one out of the six short-term sentiment gauges plotted below is at a real extreme, the others still have room to grow.
In addition to just looking at the data, I also identify other times that most closely replicate today's readings.
For example, there were 3 other signal dates that closely correlate to the market breadth data shown above and 9 signal dates that are closely correlated to current sentiment readings.
Would you like to know how the market reacted to similar conditions in the past?
Those findings, along with purely fact-based analysis is available via the Profit Radar Report.
The Profit Radar Report comes with a 30-day money back guarantee, but fair warning: 90% of users stay on beyond 30 days.
Barron's rates iSPYETF a "trader with a good track record," and Investor's Business Daily writes "Simon says and the market is playing along."
|
