Subscribers to iSPYETF’s free e-mail newsletter receive a market outlook, usually once a week. The market outlook below was sent out on August 17, 2023. If you’d like to sign up for the free e-newsletter, you may do so here (we will never share your e-mail with anyone, just as we don't accept advertising).
In preparation for this update, I just read through the last free Market Outlook, which was from July 13, and found this sentence:
"Price is now nearing a serious resistance zone. The mid 4,500s, especially if reached next week, seem like a prime spot for a pullback."
The prime spot for that pullback ended up not being 'next week' but the week after next week.
To many, that 'prime spot' for a pullback may seem random, however, the chart below shows why it made sense.
The chart was first published in the July 23 Profit Radar Report along with the following commentary:
"The Elliott Wave Theory (EWT) structure is at a point where a pullback is becoming more likely. Shown in the chart below is the most bearish version, but the advance could also be 1, 2, 3 instead of A, B, C. An upcoming decline could be a more shallow wave 4 or severe wave C (red). Based on the Risk/Reward Heat Map, the bearish version is very unlikely, but not impossible."
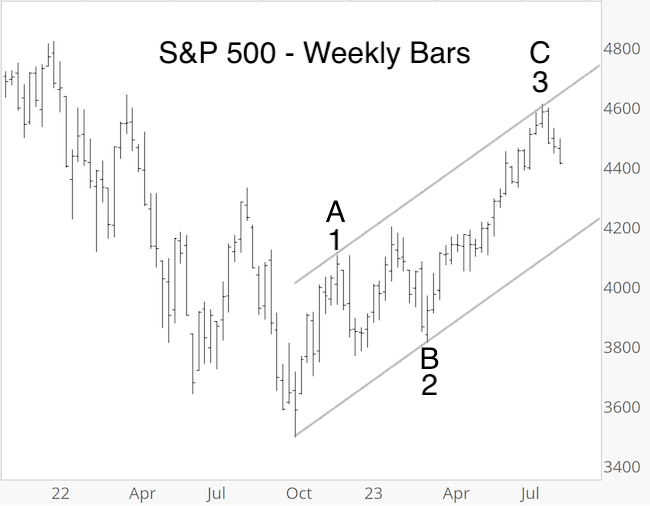
On July 27, the S&P 500 tagged the trend channel and ‘magically’ reversed. After that day, I wrote (in the July 30 Profit Radar Report): “For the first time in many months, the S&P 500 carved out a legitimate setup for a correction.”
This reversal, in fact, was exactly what I was hoping for. It happened almost with a built in guarantee, which makes future forecasting more certain.
For now, how much of a correction? I wrote previously that “a move into the 4,300s is easily possible for the S&P 500 without causing any major technical damage.”
As mentioned in the July 23 Profit Radar Report, the Risk/Reward Heat Map (RRHM) favors a wave 4 kind of a correction.
As faithful readers know, the RRHM is a compilation of hundreds of different studies that project a forward return for the next year. The RRHM strongly suggested a S&P 500 rally to about 4,300 already last year.
For now, the important thing is that the S&P 500 pulled back at an inflection zone, and we should respect that pullback and let it develop. I think the pullback will end up leading to a buying opportunity, but that's putting the cart before the horse. We'll probably have to be patient.
AAPL
The July 16 Profit Radar Report featured the chart below and warned that AAPL looks to be in the later stages of a wave 3 rally with resistance at 197.63 (upper red line, where wave 3 = 161.8 x 1).
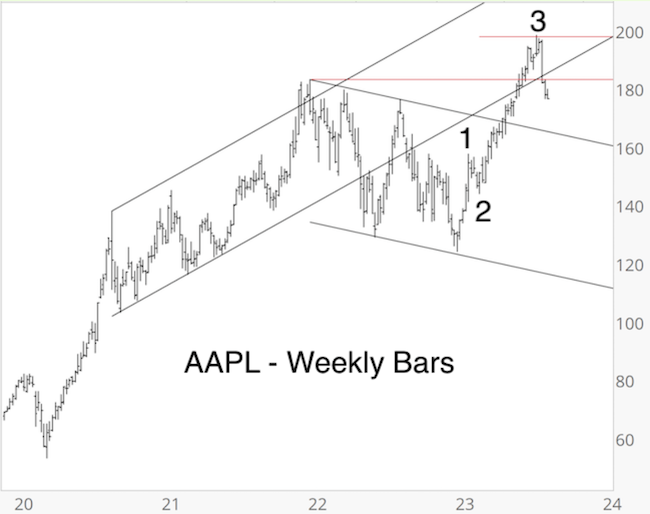
AAPL made it as high as 198.23 on July 19 and is down almost 11% since.
My working assumption is that the correction is wave 4 to be followed by wave 5 up. However, it is possible to count the advance as a much more bearish A, B, C rally.
Elliott Wave Theory (EWT)
You may be thinking: Wow, Simon’s really been nailing it with Elliott Wave Theory (EWT). But that’s not so. For much of 2022 and 2023, I have not used Elliott Wave Theory in my analysis.
I am, however, familiar with other Elliott Wave analysts and their work (which has been predominantly bearish and downright wrong for well over a year). In my humble opinion, the market’s EWT structure has been muddy and unfit to base a forecast on (most of those who made a EWT-based forecast got burnt).
It wasn’t until last month that some patterns (like the ones discussed above) become mature enough to be ‘unleashed’ to subscribers as part of my analysis.
If you are curious to read about some of the hidden gem indicators that have kept us on the right side of the market throughout 2023, you may find the 2023 S&P 500 Forecast captivating.
For continued updates, purely fact based research, and objective analysis, sign up for the Profit Radar Report.
The Profit Radar Report comes with a 30-day money back guarantee, but fair warning: 90% of users stay on beyond 30 days.
Barron's rates iSPYETF a "trader with a good track record," and Investor's Business Daily writes "Simon says and the market is playing along."
|
