To put it mildly, U.S. stocks have been in a severe funk since December 29.
How low can stocks go?
We are dealing with a stock market rogue wave. By nature, rogue waves are unpredictable freak waves. Nevertheless, they occur often enough to discern certain rogue wave patterns.
The January 10 Profit Radar Report Pointed out that: “The S&P is nearing the next support zone and our down side target. The next support and inflection zone for a bounce is 1,895 – 1,870.”
If you enjoy quality, hand-crafted research, >> Sign up for the FREE iSPYETF Newsletter
The January 13 Profit Radar Report shared this chart and commentary, illustrating the most likely outcome:
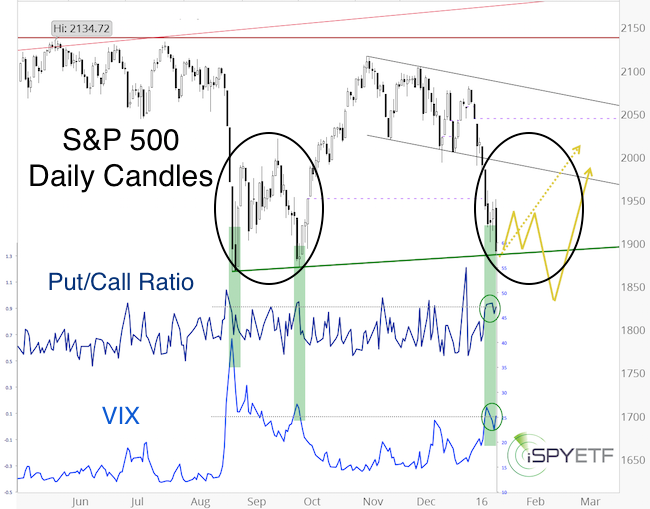
“The chart below plots the S&P 500 against the CBOE Equity Put/Call ratio (dark blue) and the VIX (light blue). We are not quite seeing the same panic readings as in August, but we’re reasonably close. It’s worth noting that there is a small bullish divergence (green circles) between the S&P 500 (which dropped to a new low) and the VIX and p/c ratio (which did not reach new extremes).
Upon completion, rogue waves tend to be followed by either 1) A snap back rally (dashed yellow projection) or 2) A choppy bounce, another low, and then a snap back rally (solid yellow projection - projection shows only general shap of move, not necessarily true to price or time). Compare to 2011 crash wave.
The August meltdown (black circle) was followed by a hybrid of the above two scenarios. Rogue waves don’t follow rules and may extend further than anticipated, however, based on nearby support at 1,890 – 1,870, this decline could be near its termination point (or already over).”
At this point in time, the S&P is enjoying the biggest intraday gain of the year. Now we’ll have to see if it follows the dashed or solid yellow projection more closely. Of course, being a rogue wave, it may continue lower (October 2014 low at 1,820?), that's why we never front run such powerful moves.
For continuous updates and hand-crafted out-of-the-box research, test drive the Profit Radar Report and become the best-informed investor you know.
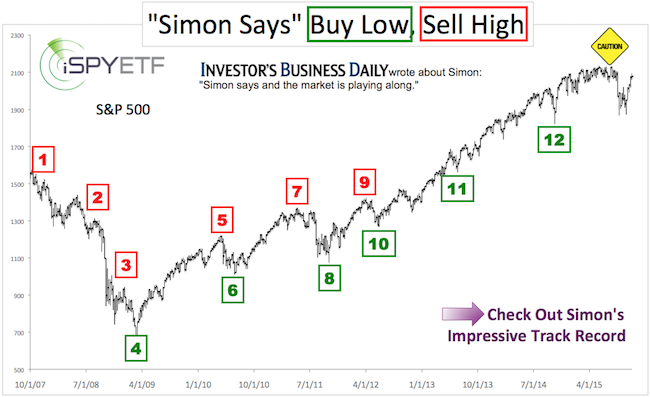
Simon Maierhofer is the publisher of the Profit Radar Report. The Profit Radar Report presents complex market analysis (S&P 500, Dow Jones, gold, silver, euro and bonds) in an easy format. Technical analysis, sentiment indicators, seasonal patterns and common sense are all wrapped up into two or more easy-to-read weekly updates. All Profit Radar Report recommendations resulted in a 59.51% net gain in 2013 and 17.59% in 2014.
Follow Simon on Twitter @ iSPYETF or sign up for the FREE iSPYETF Newsletter to get actionable ETF trade ideas delivered for free.
If you enjoy quality, hand-crafted research, >> Sign up for the FREE iSPYETF Newsletter
|
