Subscribers to iSPYETF’s free e-mail newsletter receive a market outlook, usually once a week. The market outlook below was sent out on February 24, 2022. If you’d like to sign up for the free e-newsletter, you may do so here (we will never share your e-mail with anyone, just as we don't accept advertising).
Much has happened and yet not much has changed. The February 2 Profit Radar Report (and February 3, Free Market Outlook) pointed out that a standard S&P 500 impulsive decline (Elliott Wave talk for trend conforming 5-wave move) is no longer possible (due to a wave 4, wave 1 overlap), but plotted out the diagonal shown below.
This diagonal, which required a wave 5 down (to new lows and beyond) has been my default 'blue print' since first publishing it on February 2.
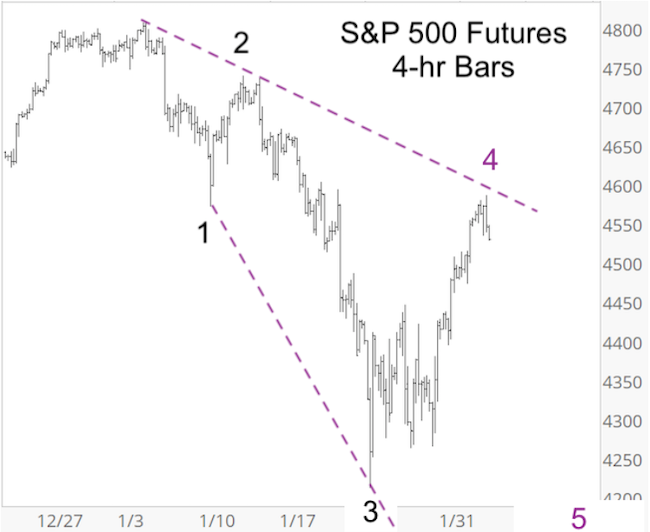
As the pattern matured, it provided validation and invalidation levels. Two of those were published in the February 16 Profit Radar Report:
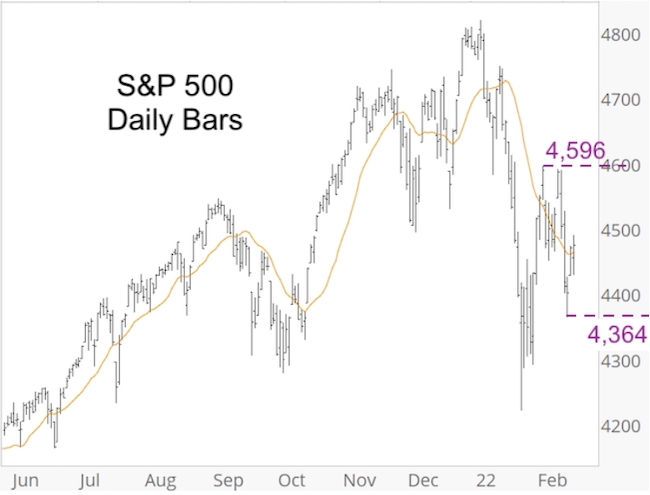
- Invalidation level: 4,596
- Validation level: 4,364
The S&P fell below 4,364 last Friday to further validate the diagonal.
As a side note, the yellow line shown is the 18-day SMA. It was plotted because a subscriber had asked if the S&P 500 closing above the 18-day SMA (on February 16) is bullish.
The explanation was a bit longer than you'll want to read, but the short answer - considering the circumstances - was: No, not bullish.
Back to the diagonal though. In addition to providing validation and invalidation levels, it also provides a minimum down side target.
In fact, it's not a diagonal if the down side target is not met. Since we knew the minimum down side target from the beginning, we've been looking for lower prices ... and continue to do so.
In terms of chart support, the S&P tagged minor support around 4,130 today and closed the open chart gap at 4,116.93 (dashed purple line).
RSI-2 is over-sold, which normally causes a bounce, but - based on Elliott Wave Theory - stocks are likely in a wave 3 decline (the most powerful portion of a down leg), which means over-sold readings can be ignored for a while.
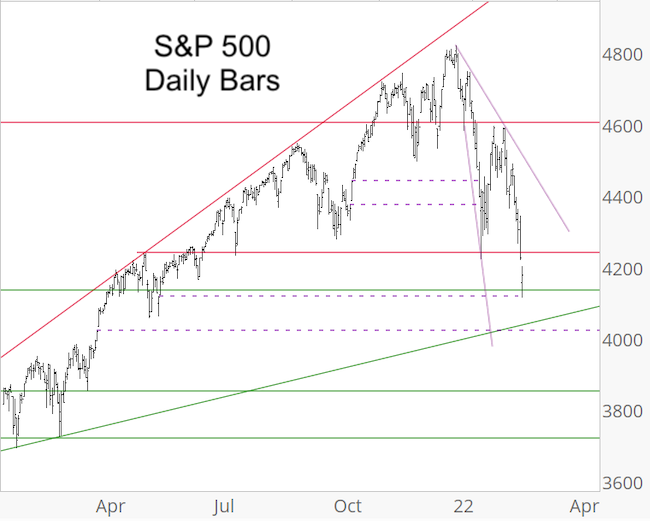
Perhaps most importantly though, the minimum down side target of the diagonal has not been reached. Once it is - with or without prior bounce - we are actually looking for a low-risk entry to buy.
The minimum down side target of the diagonal, and objective fact based research updates are available via the Profit Radar Report.
The Profit Radar Report comes with a 30-day money back guarantee, but fair warning: 90% of users stay on beyond 30 days.
Barron's rates iSPYETF a "trader with a good track record," and Investor's Business Daily writes "Simon says and the market is playing along."
|
