The S&P 500 is enjoying its largest 1-day pop since May 24. Is this a dead cat bounce or the beginning of a new up trend?
Cause and Effect
What caused this bounce will help us figure out whether it has legs.
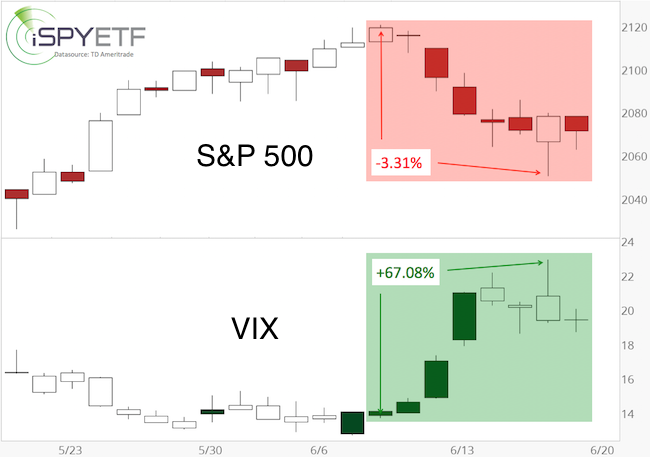
Monday’s pop comes on the heels of an interesting losing streak. The S&P was down 6 of the prior 7 days, but lost only a relatively tame 3.31%.
There was nothing tame about the VIX’s reaction however, spiking as much as 67.08% (see chart below).
On June 8 (when the S&P closed at 2,119), the Profit Radar Report recommended to short the S&P 500 once it drops below 2,110 with the following reasoning:
“At this point, we can’t quantify the maximum down side risk, but we know there’s potential for a deeper pullback once this rally is complete. We want to have some skin in the game should there be a sizeable decline. This is an insurance trade against missing out. We will go short if the S&P 500 drops below 2,110.”
Barron's rates iSPYETF as a "trader with a good track record." Click here for Barron's assessment of the Profit Radar Report.
The FOMO Trade
We termed this the FOMO insurance trade. What is a FOMO insurance trade? FOMO stands for ‘fear of missing out.’ Having insurance allowed us to watch the S&P losing streak knowing that we’ll make money as the market drops (and if it continues to fall).
If you enjoy quality, hand-crafted research, >> Sign up for the FREE iSPYETF Newsletter
Insurance usually comes at a price. However, with our stop-loss at break even, our insurance came free and offered the mental peace only a well-timed entry can provide.
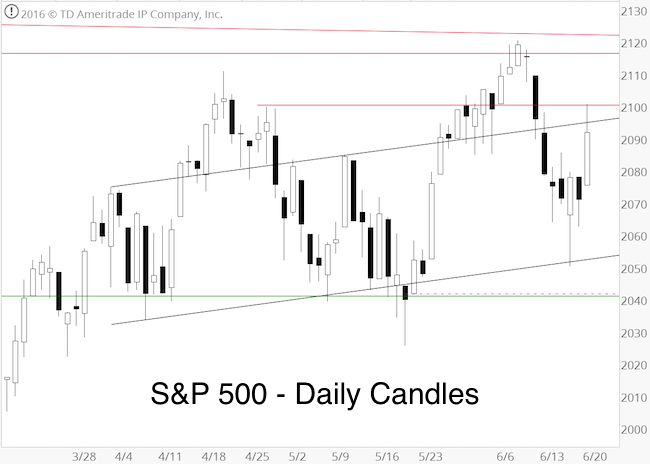
On June 15 however, the Profit Radar Report warned of an impending bounce and stated:
“Following five consecutive down days, the S&P is compressed and prone to bounce. Based on Elliott Wave Theory, this bounce should stop at 2,090 – 2,110 and relapse to new lows. Trade above 2,110 (and especially 2,121) would unlock much more bullish options. Investors that prefer to lock in a small paper gain rather than holding out for a potentially bigger gain may close out the S&P short position.”
At Friday’s close, the S&P 500 carved out a bullish divergence (see chart below – published via the June 19 Profit Radar Report).
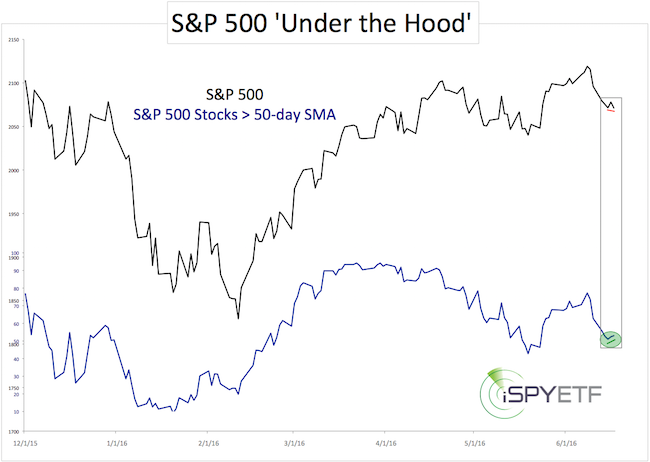
This bullish divergence combined with an oversold condition caused Monday’s bounce.
Thus far, the S&P remains in the 2,090 – 2,110 target/reversal zone. Bearish post triple witching seasonality suggests this is just a dead cat bounce. It would take a move about 2,121 to 'resurrect the dead cat.'
Continued S&P 500 analysis is available via the Profit Radar Report.
Simon Maierhofer is the founder of iSPYETF and the publisher of the Profit Radar Report. Barron's rated iSPYETF as a "trader with a good track record" (click here for Barron's profile of the Profit Radar Report). The Profit Radar Report presents complex market analysis (S&P 500, Dow Jones, gold, silver, euro and bonds) in an easy format. Technical analysis, sentiment indicators, seasonal patterns and common sense are all wrapped up into two or more easy-to-read weekly updates. All Profit Radar Report recommendations resulted in a 59.51% net gain in 2013, 17.59% in 2014, and 24.52% in 2015.
Follow Simon on Twitter @ iSPYETF or sign up for the FREE iSPYETF Newsletter to get actionable ETF trade ideas delivered for free.

If you enjoy quality, hand-crafted research, >> Sign up for the FREE iSPYETF Newsletter
|
