The May 11 Profit Radar Report featured the VIX:VXV ratio (click here for chart and more details) and concluded that: “Today’s S&P 500 reversal after closing the open chart gap neutralizes and reversed the bullish edge discussed Sunday. Potential near-term target: Below 2,040.”
Barron's rates the iSPYETF as a "trader with a good track record." Click here for Barron's assessment of the Profit Radar Report.
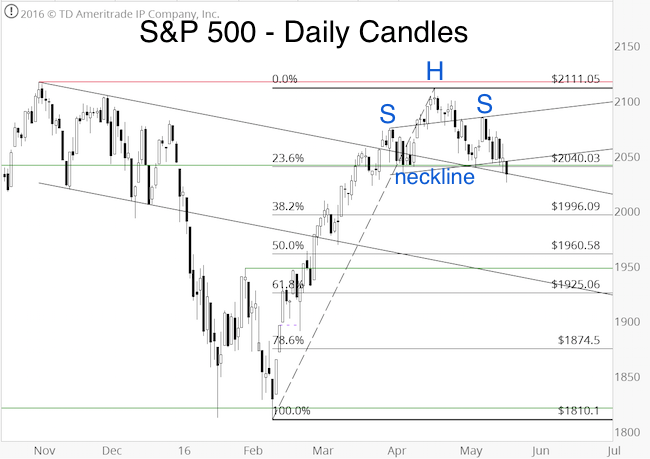
As the chart below shows, 2,040+/- is important not only because it’s been tested ten times since April. It is also:
-
A long-term Fibonacci projection level
-
Short-term Fibonacci retracement level
-
Double trend channel support
-
Neckline of a potential head-and shoulders pattern
Yesterday’s Profit Radar Report pointed out internal deterioration and stated:
“Price is masking internal weakness. Even though the S&P didn’t close at a new low, the % of S&P 500 stocks above their 50-day SMA dropped to the lowest level since February 19, and the NY Comp a/d line dipped to a 10-day low. According to Elliott Wave Theory, a notable drop (wave 3 down) could be on the horizon. Various other indicators contradict each other, but show a general bias towards lower prices (perhaps indicating a choppy stair-step decline). With or without prior bounce, the odds favor a drop below 2,040.”
If you enjoy quality, hand-crafted research, >> Sign up for the FREE iSPYETF Newsletter
The S&P 500 is now below key support. Regardless of the exact shape and scope of the decline, this puts the bears in the drivers seat until further notice (= break above resistance, or bullish divergence against support).
There is a real chance the S&P will continue to follow the projection featured in the April 13 Profit Radar Report, also published here.
One word of caution: The importance of the 2,040 level has become quite obvious. Mr. Market takes pleasure in fooling the obvious trade. We’ll be watching various breadth and sentiment indicators (and support around 2,020) even more closely for tell-tale signs of a ‘fool the crowd curveball.’
Update:
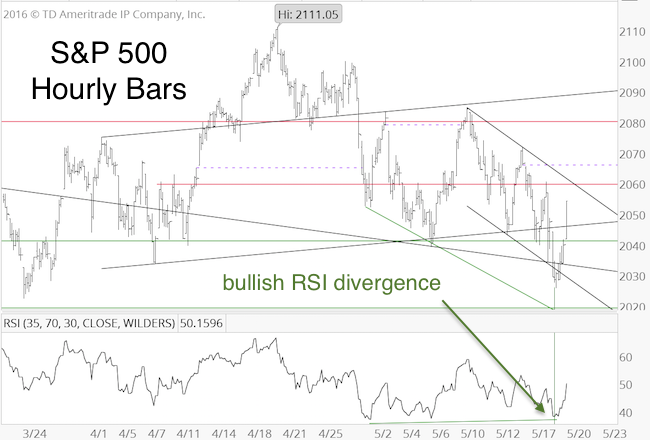
Here is the curveball discussed above, and via the May 18 Profit Radar Report: "However, support around 2,040 has become pretty obvious, perhaps too obvious. There is two ways the market may deal with a too obvious setup: 1) By-pass support via a gap down open 2) Seesaw across support and take out stop loss orders before embarking upon the real move. The market may deliver some fakeout moves (or gaps) near the 2,040 zone, but once the fakeout moves/gaps are out of the way, we may get a setup. The hourly chart still shows potential for a bullish RSI divergence." The RSI divergence is shown below.
Continued S&P 500 analysis is available via the Profit Radar Report.
Simon Maierhofer is the founder of iSPYETF and the publisher of the Profit Radar Report. Barron's rated iSPYETF as a "trader with a good track record" (click here for Barron's profile of the Profit Radar Report). The Profit Radar Report presents complex market analysis (S&P 500, Dow Jones, gold, silver, euro and bonds) in an easy format. Technical analysis, sentiment indicators, seasonal patterns and common sense are all wrapped up into two or more easy-to-read weekly updates. All Profit Radar Report recommendations resulted in a 59.51% net gain in 2013, 17.59% in 2014, and 24.52% in 2015.
Follow Simon on Twitter @ iSPYETF or sign up for the FREE iSPYETF Newsletter to get actionable ETF trade ideas delivered for free.

If you enjoy quality, hand-crafted research, >> Sign up for the FREE iSPYETF Newsletter
|
