Subscribers to iSPYETF’s free e-mail newsletter receive a market outlook, usually once a week. The market outlook below was sent out on October 7, 2021. If you’d like to sign up for the free e-newsletter, you may do so here (we will never share your e-mail with anyone, just as we don't accept advertising).
I shared the following chart in Sunday's Profit Radar Report to show that most breadth measures (NY Composite advance/decline lines, new 52-week highs - lows) did not confirm a breakdown (see triangles).
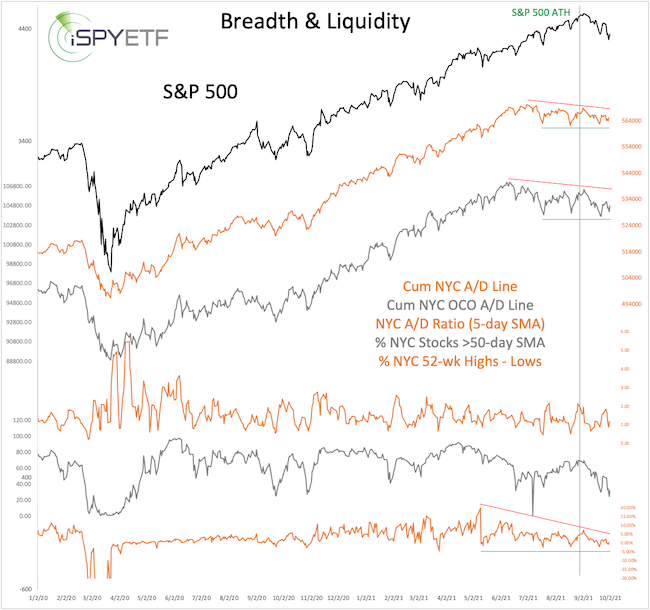
Sunday's conclusion - based on the above and other facts - was this:
"Near-term resistance is around 4,380 - 4,400 followed by 4,440 +/- 10. We are allowing for the open chart gap at 4,436.19 to be filled, but a close above 4,450 - 4,470 would reduce the probabilities of a deeper down turn."
As the chart below shows, the S&P is within striking distance of the open chart gap (dashed purple line) and now back above the bold trend line (which goes back to 2018) and the 18-day SMA. A close back above the 18-day SMA has ended the last 3 pullbacks.
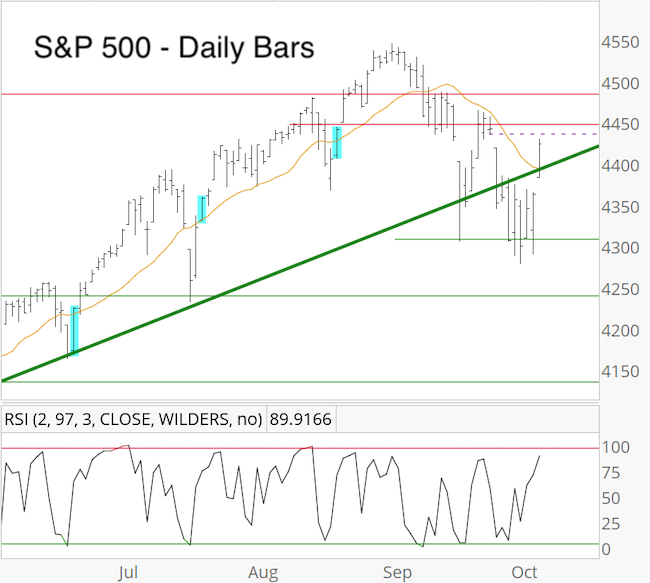
If bears don't step up soon, they'll have fumbled another chance to take control at least for a little while.
On a slightly different note, over the past several weeks, the S&P 500 and VIX have delivered readings that also appeared prior to every major market top over the past 20 years.
Purely mathematically, the 'meltdown risk' came out to be 33.75%. A detailed explanation was published here, but, the risk comes with an important 'but' and unfortunately not all charts made it.
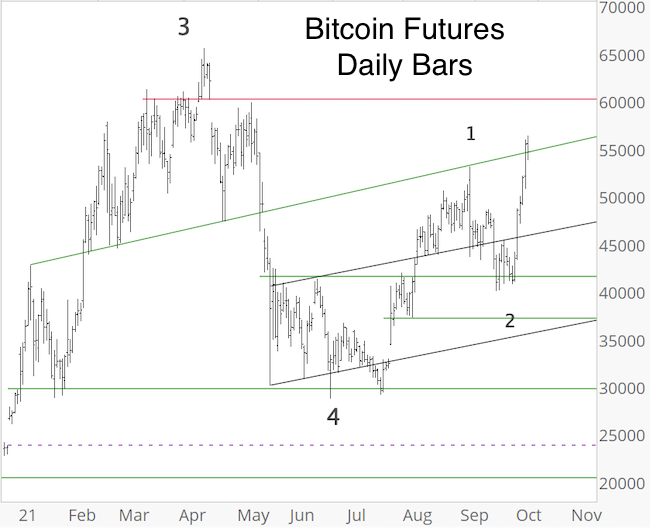
Bitcoin Futures soared from 41,000 to 56,000 over the past week. The Elliott Wave count first shown in the September 22 Profit Radar Report explains the surge.
Continued updates, out-of-the box analysis and forward performance based on historic precedents are available via the Profit Radar Report.
The Profit Radar Report comes with a 30-day money back guarantee, but fair warning: 90% of users stay on beyond 30 days.
Barron's rates iSPYETF a "trader with a good track record," and Investor's Business Daily writes "Simon says and the market is playing along."
|
