Subscribers to iSPYETF’s free e-mail newsletter receive a market outlook, usually once a week. The market outlook below was sent out on March 14, 2024. If you’d like to sign up for the free e-newsletter, you may do so here (we will never share your e-mail with anyone, just as we don't accept advertising).
First mover advantage is a competitive advantage gained from being the first to introduce and distribute a product. Famous examples are said to include Coca Cola, Kellogg’s, Apple, Google.
There is also a ‘first mover’ advantage when it comes to stock market indicators. Those who first recognize the validity of an emerging indicator benefit before, and until, the crowd catches on. By the time an indicator becomes widely-known, it usually has lost some or much of its accuracy.
One of those indicators is the cumulative NY Composite advance/decline line (NYC a/d line). The NYC a/d line is basically a running total of daily net advancing stocks.
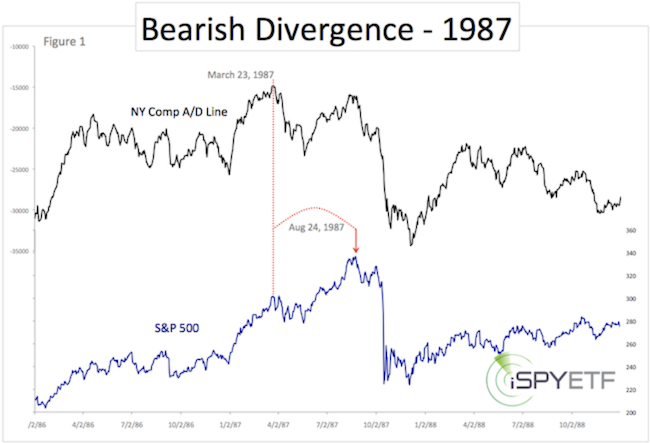
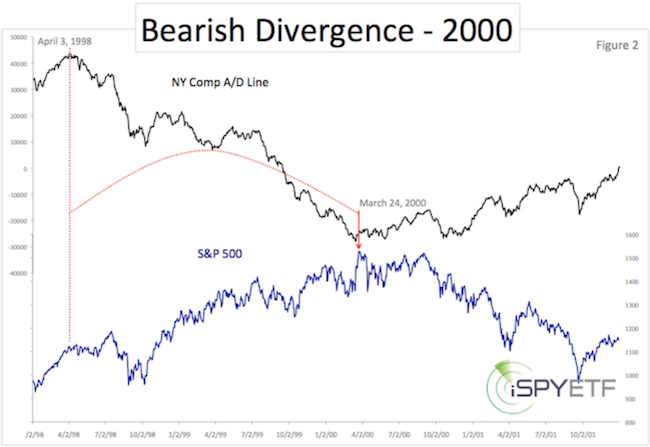
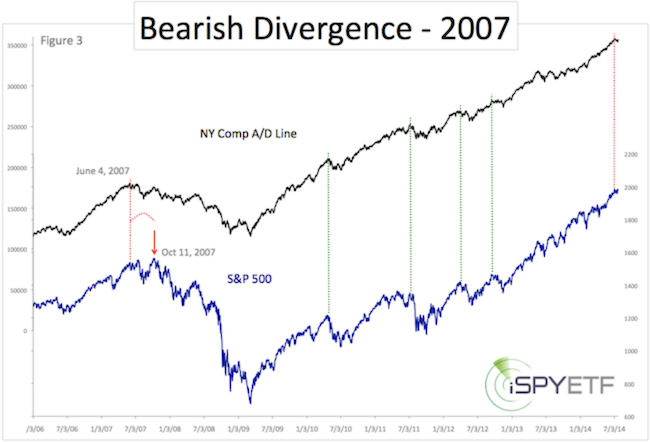
A bearish divergence between the S&P 500 and the NYC a/d line correctly foreshadowed the 1987, 2000 and 2007 market crashes.
The 3 charts below outline the divergences that developed in 1987, 2000 and 2007. The charts and analysis were published in my July 24, 2014 Special Report entitled: How to Discern A Major Market Top (available to subscribers of the Profit Radar Report).
At the time - over a decade ago - the Profit Radar Report was one of the only newsletters to focus on the NYC a/d line. Using that indicator served subscribers well. Ever since the 2009 bear market low, we’ve used the NYC a/d line to evaluate if a major market top was forming.
Based on my interpretation of the data, The Profit Radar Report has not called for a major market top at any point over the past 10+ years (can you think of any other market forecasting service who hasn’t called for a major market top in over a decade?).
Starting a few years ago, the NYC a/d line morphed from a little known indicator to a popular discussion topic. By now, you’ve probably seen or heard that the NYC a/d line has carved out one of the biggest divergence ever, dating back to the November 8, 2021 all-time high (see chart below).
In fact, for the past 2+ years, many analysts have been pounding the table, predicting a 1987/2000/2007-like crash because of that divergence.
Not the Profit Radar Report. We milked the first mover advantage while it was there but were smart enough not to jump on the 'bearish divergence will lead to crash' bandwagon.
Below are a few excerpts of how the Profit Radar Report disarmed the bearish NYC a/d line divergence:
The 2023 S&P 500 Forecast didn’t dwell on the bearish divergence, but highlighted that: “We will now look for signs of strength (a bullish divergence) that may suggest a bear market low is in place and/or if new all-time highs could be on the horizon.”
The 2024 S&P 500 Forecast also discounted the meaning of the bearish divergence and stated: “Although the cumulative NYC a/d lines are lagging, a renewed bearish divergence won’t occur until the S&P 500 reaches a new all-time high. Such a divergence, if and when it occurs, is certainly not a positive, but based on the weight of evidence, it may also not be a big negative force this time around. Perhaps, in time, an upcoming bearish divergence will even be erased.”
Fast forward to today; The bearish NYC a/d line divergence is almost erased. It will only take 197 more stocks advancing than declining and the bearish divergence will have been erased (as of yesterday's close). No doubt many analysts will tout this new high - whenever it occurs - as an ‘all clear’ signal.
And while erasing that long-time bearish divergence would be a positive for stocks, it doesn’t mean stocks can’t correct and shake out the weak hands.
The NYC a/d line used to be my go-to indicators, now it's just one of many. In fact, the weight of evidence (focusing on other time-tested indicators not yet discovered by the crowd) is what led me to believe that the bearish divergence will be erased without any damage being done first (see 2024 S&P 500 Forecast).
Momentum Markets
Momentum markets - like the one we're in right now - are a special breed and frustrate many investors. This article (based on a recent Profit Radar Report update) highlights how other momentum markets played out and what we learned from them.
What about the Yellow Flags?
The last Free Market Outlook (from February 22) mentioned yellow flags (mainly lagging breadth). Are they still a concern?
Market breadth has improved and has been down graded as concern. It is now important to view price action in context of a momentum market.
The best way to navigate a momentum market is to allow price to grind higher as long as support holds (this was also mentioned in the February 22, Free Market Outlook).
The chart below shows the S&P 500 since the October low.
Wedges like the one outlined by the red and green line can fall apart quickly. The first step - and next yellow flag - will be a close below the green line. This wouldn't be an automatic sell signal, but could be the first tell-tale sign of a deeper pullback.
Continued updates based on purely fact-based analysis is available via the Profit Radar Report.
The Profit Radar Report comes with a 30-day money back guarantee, but fair warning: 90% of users stay on beyond 30 days.
Barron's rates iSPYETF a "trader with a good track record," and Investor's Business Daily writes "Simon says and the market is playing along."
|
