2015 has been the year of trading ranges. The S&P 500 was stuck in a 100-point range from February to August and again from October until now.
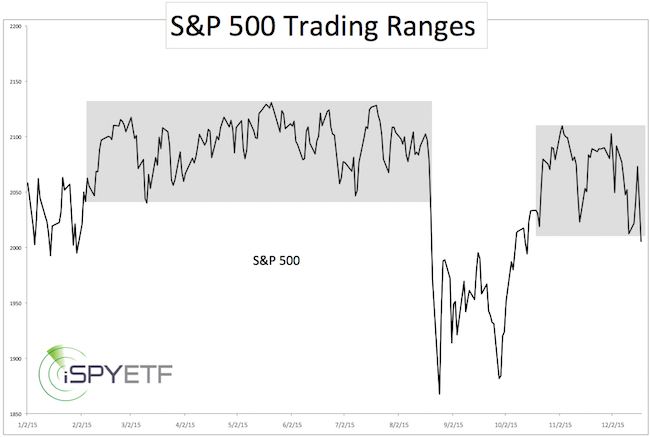
Prolonged periods of zig-zagging tend to wear down support/resistance levels and dilute the effectiveness of technical analysis.
At times like this, it makes sense to overweigh other indicators to get a better read on the market. Here are a few of them:
Seasonality:
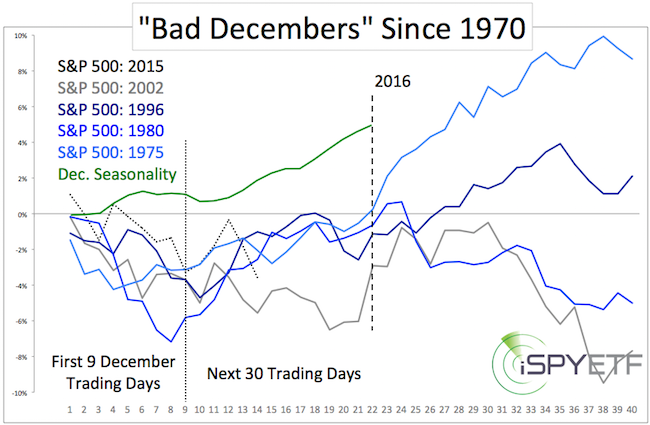
As of December 11, the S&P 500 was down 3.27%. Such poor performance is unusual for December. In fact, since 1970, the S&P 500 lost more than 3% after the first nine December trading days only four prior times (1975, 1980, 1996, 2002).
The graphs below (originally published in the December 13 Profit Radar Report) represent all years with 3%+ losses after the first nine December trading days (dashed black line) along with the performance over the next 30 trading days. December seasonality (green graph) typically turns notably bullish in mid-December.
If you enjoy quality, hand-crafted research, >> Sign up for the FREE iSPYETF Newsletter
Here’s another December anomaly:
Last week (Thursday/Friday), the S&P had two 1.5% back-to-back losses in the second half of December. According to SentimenTrader, this hasn’t happened since 1937.
Since 1928, there’ve only been eight back-to-back losses of more than 1% during the second half of December. All of those were during bear markets, but the S&P ended the year above the second down day level every single time.
Market Breadth
The December 6 Profit Radar Report pointed out extremely weak market breadth (more details here: Why are Stocks Down Despite Bullish Seasonality?).
Buyers fatigue is not always a short-term timing toll, but it’s been like a dark cloud over Wall Street, and certainly contributed to the lousy December performance.
There’s a small tell tale sign that buyers may be awakening (perhaps only for a little while). How so?
As the chart below shows, on Friday, the S&P closed at the lowest level since October 13. Some market technicians may consider this a technical breakdown, however, there was a bullish divergence between the S&P 500 and the percentage of NYSE stocks above their 50-day SMAs.
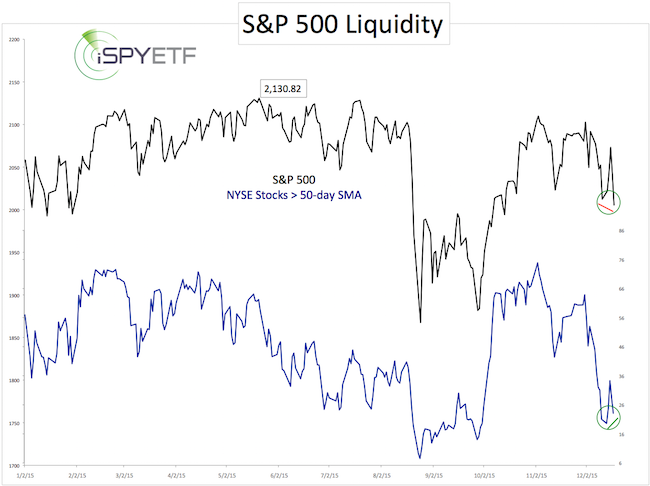
At least by one measure, selling was not as strong as price suggests. More often than not that’s a good sign.
Based on technicals, last week’s low at 1,993 seems important for the S&P 500.
Summary:
As long as the bullish divergence and support at 1,993 hold, positive December seasonality deserves the benefit of the doubt.
Simon Maierhofer is the publisher of the Profit Radar Report. The Profit Radar Report presents complex market analysis (S&P 500, Dow Jones, gold, silver, euro and bonds) in an easy format. Technical analysis, sentiment indicators, seasonal patterns and common sense are all wrapped up into two or more easy-to-read weekly updates. All Profit Radar Report recommendations resulted in a 59.51% net gain in 2013 and 17.59% in 2014.
Follow Simon on Twitter @ iSPYETF or sign up for the FREE iSPYETF Newsletter to get actionable ETF trade ideas delivered for free.
If you enjoy quality, hand-crafted research, >> Sign up for the FREE iSPYETF Newsletter
|
