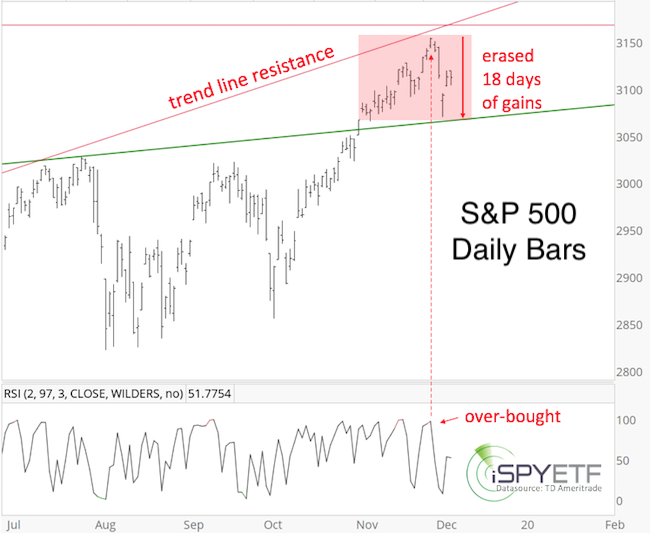
it happened again: The S&P 500 erased a month worth of gains in just 3 days. Being aware of the up side potential compared to down side risk is always a good idea, but especially now.
Let’s objectively assess bullish and bearish factors to determine up side potential vs down side risk for the short-and long-term.
Up Side Potential - Short-term
The October 20 Profit Radar Report published the S&P 500 futures chart below and stated that: “A close above 3,002 (blue triangle) could eventually lead as high as 3,187.75 (3,167.74 for S&P 500).”
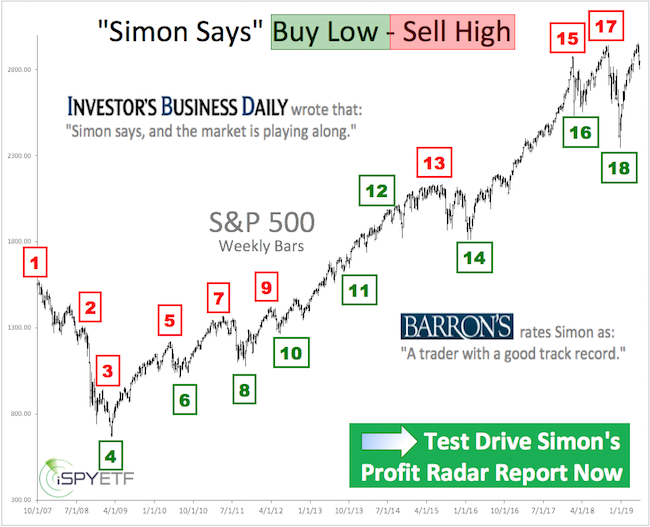
Barron's rates iSPYETF as "trader with a good track record" and Investor's Business Daily says: "When Simon says, the market listens." Find out why Barron's and IBD endorse Simon Maierhofer's Profit Radar Report.
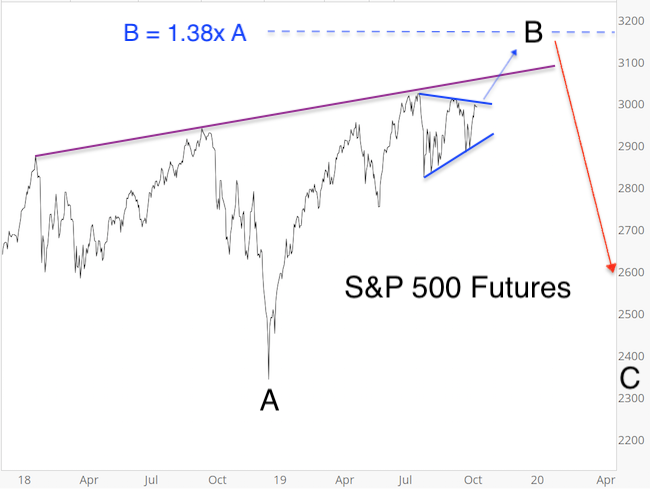
The S&P 500 came within 12 points of this target and then dropped 84 points in 3 days (as projected, see last chart of this article). Based on the above projection, near-term up side potential is limited.
Up Side Potential - Longer-term
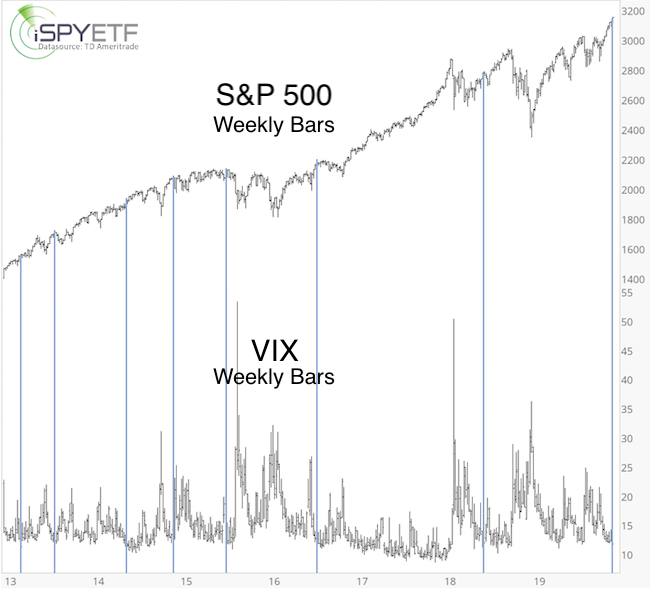
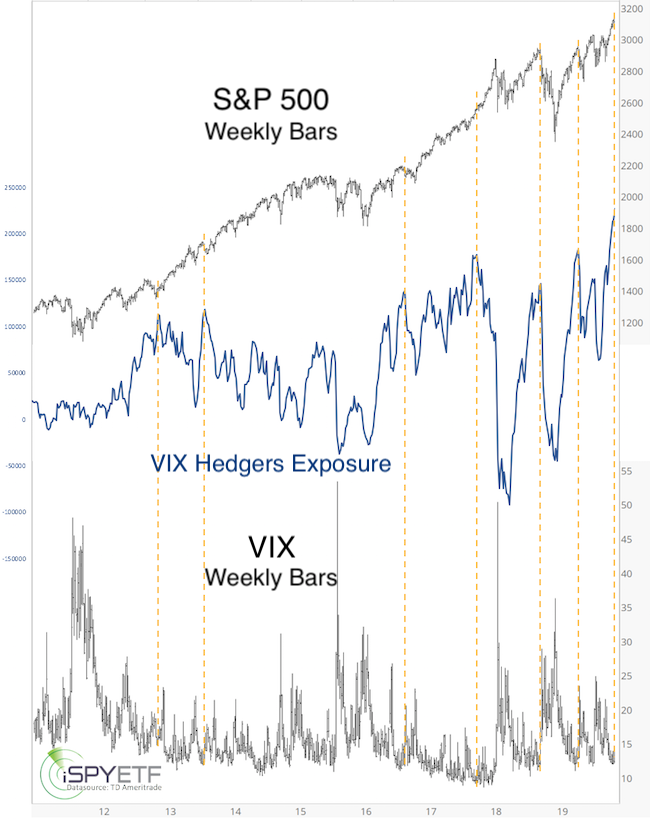
On November 25, the VIX closed below 12 for the first time in 3 months. Over the past 20 years, this has happened 8 other times. 1 year later the S&P 500 traded higher every time (the blue lines below highlight the instances since 2013).
On November 25, the Russell 2000 reached a new 52-week highefor the fist time in a year. Over the past 20 years, this happened 5 other times. 1 year later, R2K traded higher 4 of 5 times.
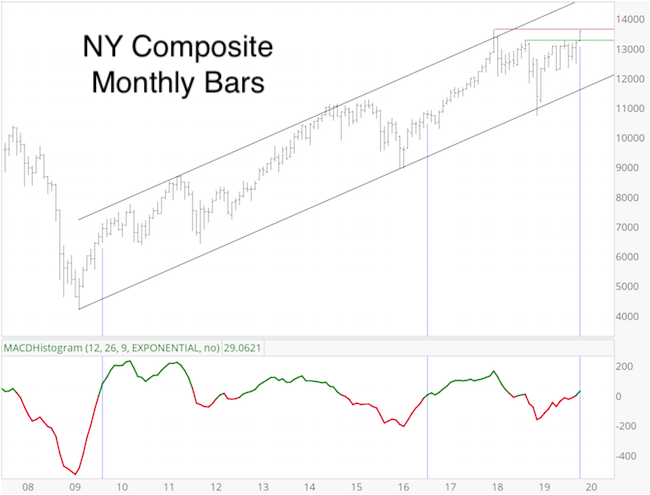
For the first time since August 2018, the monthly MACD histogram for the NY Composite crossed above 0. The blue lines below highlight times when the MACD histogram exceeded 0 for the first time in a year. This signal was rare (only 6 times since 1980) and always followed by gains 1 year later (on average 16%).
Short-term Down Side Risk - Short-term
The November 24 PRR mentioned that VIX hedgers held a record amount of VIX positions and warned: “The last two times this happened, the VIX spiked and S&P 500 took a nasty spill.”
If you enjoy quality, hand-crafted research, >> sign up for the FREE iSPYETF e-newsletter & market outlook
From November 27 - December 3, the VIX soared as much as 50%. This may have satisfied the need for a VIX spike already, but more could still be to come.
Longer-term Down Side Risk
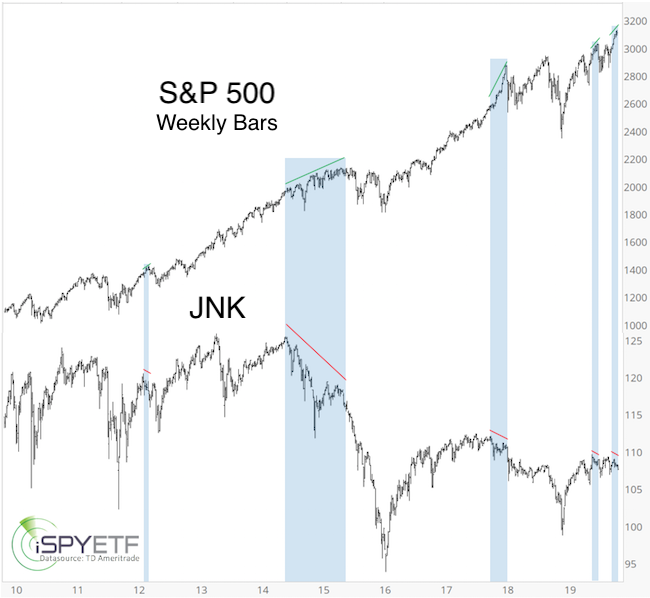
The November 20 PRR noted that: “Unlike stocks, junk bonds have been trending lower. The chart below plots the S&P 500 against the SPDR High Yield Bond ETF (JNK). The blue boxes highlight other periods where JNK trended lower while the S&P trended higher. It usually and eventually led to stock market pullbacks of various degrees.”
If you enjoy quality, hand-crafted research, >> sign up for the FREE iSPYETF e-newsletter & market outlook
It is difficult to put a time-frame on this 'setup' as the bearish divergence could be followed by weakness sooner or later.
Conclusion
When compiling my forecasts I look for ‘signal clusters.' Those are times when indicators and studies coherently suggest a specific performance over a certain time frame.
Right now, a cluster of bullish studies suggests that stocks will be higher about 1 year from today.
Another cluster of indicators projects lower prices over the next 3 month. This cluster, however, is in conflict with the strong momentum market we’ve seen since early October.
In short, the weight of evidence suggests that pullbacks over the next 3 month are an opportunity to buy.
The yellow projection below, published in the December 1 Profit Radar Report, outlined a path in harmony with a number of indicators.
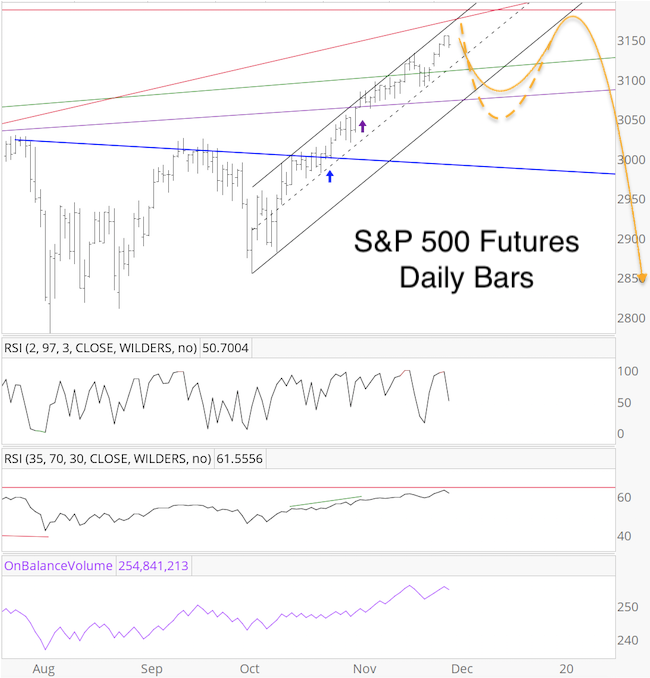
As you can see, the projection correctly captured the decline from 3,150 to below 3,100. Another rally to the high is quite possible and - if all goes according 'to plan' - should be followed by another pullback, potentially a much deeper, but also temporary one.
Continued updates, projections, buy/sell recommendations are available via the Profit Radar Report.
Simon Maierhofer is the founder of iSPYETF and the publisher of the Profit Radar Report. Barron's rated iSPYETF as a "trader with a good track record" (click here for Barron's evaluation of the Profit Radar Report). The Profit Radar Report presents complex market analysis (S&P 500, Dow Jones, gold, silver, euro and bonds) in an easy format. Technical analysis, sentiment indicators, seasonal patterns and common sense are all wrapped up into two or more easy-to-read weekly updates. All Profit Radar Report recommendations resulted in a 59.51% net gain in 2013, 17.59% in 2014, 24.52% in 2015, 52.26% in 2016, and 23.39% in 2017.
|