To assess the S&P 500 crash vs buy the dip odds, we will first compare the January 2018 with the September 2018 all-time high.
The Guarantee
The January S&P 500 high (2,872.87) was accompanied by record high momentum/RSI readings (see second chart). Bull markets never end on peak momentum.
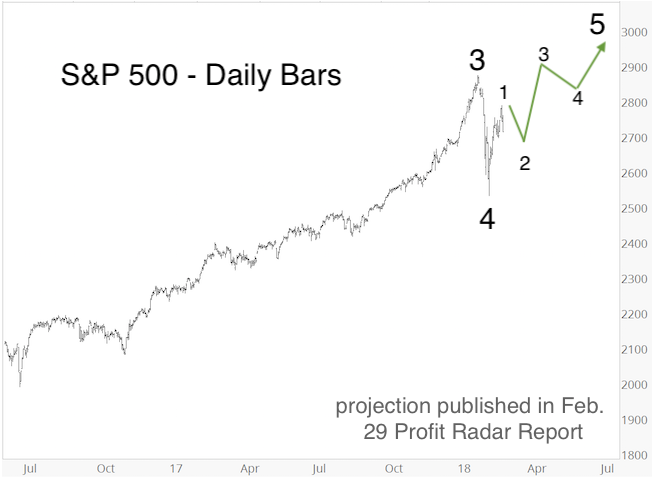
This virtually guaranteed that the January high would be exceeded eventually, which is why the Profit Radar Report published the projection below back in February (my up side target was about 3,000).
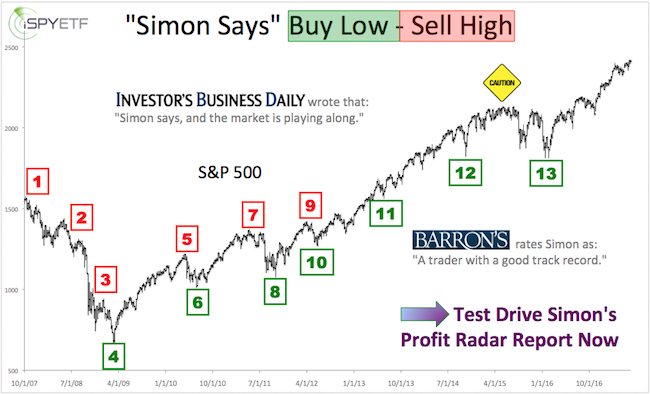
Barron's rates iSPYETF as "trader with a good track record" and Investor's Business Daily says: "When Simon says, the market listens." Find out why Barron's and IBD endorse Simon Maierhofer's Profit Radar Report.
The S&P eclipsed the January high in August, and again in September. By that time, various bearish divergences (including RSI) became obvious. Continuous all-time highs were no longer guaranteed, and down side risk began to outweigh up side potential.

Game-changer?
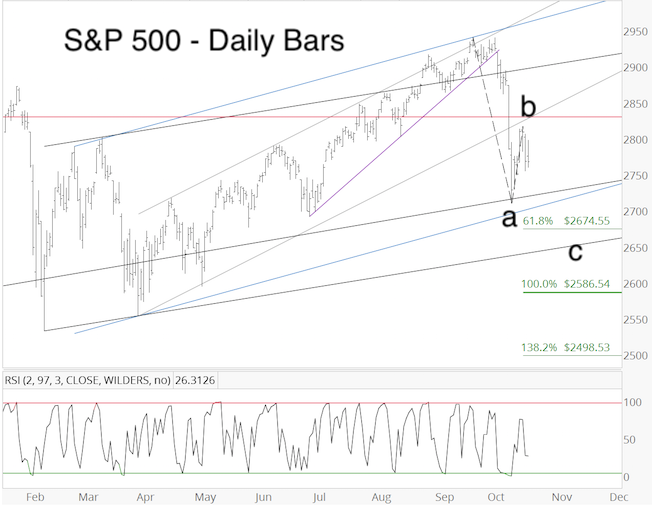
The October drop was likely a game-changer in term of Elliott Wave Theory, which now suggests that some sort of orthodox top is in place.
Bullish seasonality, however, should not be ignored, and even a counter trend bounce (according to Elliott Wave Theory) could still challenge or exceed the orthodox October high.
Multi-indicator-based Outlook
The October 14 Profit Radar Report looked at breadth & momentum, price patterns, support & resistance levels, breadth & liquidity, investor sentiment, seasonality & cycles, and Elliott Wave Theory. The conclusion, based on the above indicators, was as follows:
“Emotions are running high and price may be all over the place in coming weeks. When stitching all the factors discussed above together, a brief bounce to about 2,800, followed by another low around 2,700, followed by a choppy rally to about 2,830 (up to 2,900) seems most likely.”
Subsequently, the S&P bounced as high as 2,816.94 and today fell as low as 2,691.43.
If you enjoy quality, hand-crafted research, >> Sign up for the FREE iSPYETF Newsletter
What's next?
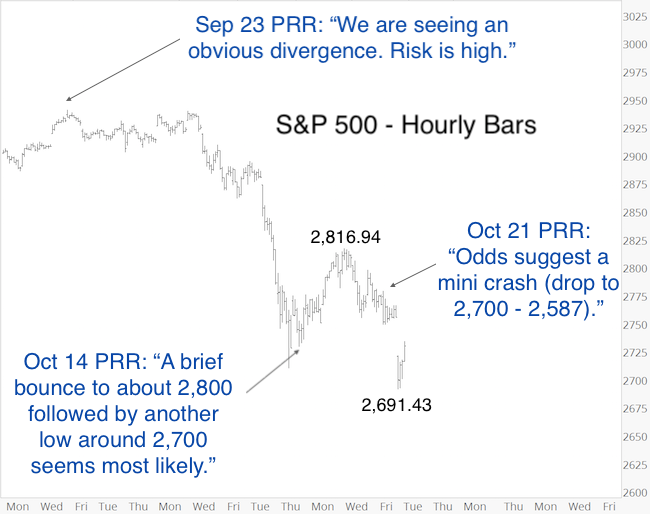
Sunday’s (October 21) Profit Radar Report published the chart below, and pointed out that: “Although we are aware of, and monitor, some very bearish outcomes, odds suggest that a mini crash (drop to S&P 2,700 - 2,587) would be a low-risk opportunity to go long either for a brief bounce or a year-end rally that will carry back towards 2,900.”
Today delivered the mini crash (from 2,755 - 2,691), and based on the reversal, this leg down may have concluded. Next question is how long will this bounce last?
Continued updates are available via the Profit Radar Report.
Simon Maierhofer is the founder of iSPYETF and the publisher of the Profit Radar Report. Barron's rated iSPYETF as a "trader with a good track record" (click here for Barron's profile of the Profit Radar Report). The Profit Radar Report presents complex market analysis (S&P 500, Dow Jones, gold, silver, euro and bonds) in an easy format. Technical analysis, sentiment indicators, seasonal patterns and common sense are all wrapped up into two or more easy-to-read weekly updates. All Profit Radar Report recommendations resulted in a 59.51% net gain in 2013, 17.59% in 2014, 24.52% in 2015, 52.26% in 2016, and 23.39% in 2017.
Follow Simon on Twitter @ iSPYETF or sign up for the FREE iSPYETF Newsletter to get actionable ETF trade ideas delivered for free.
|
