Subscribers to iSPYETF’s free e-mail newsletter receive a market outlook, usually once a week. The market outlook below was sent out on September 9. If you’d like to sign up for the free e-newsletter, you may do so here (we will never share your e-mail with anyone, just as we don't accept advertising).
The S&P 500 finished August perched on an all-time high (ATH). In the past, August highs have often made investors cry.
Since 1970, the S&P carved out 12 other August ATHs (it set a 6-year high in 1979 and missed a new ATH by a few tics in 1984). All 14 signal dates (starting with the first day of September) are shown and highlighted below.
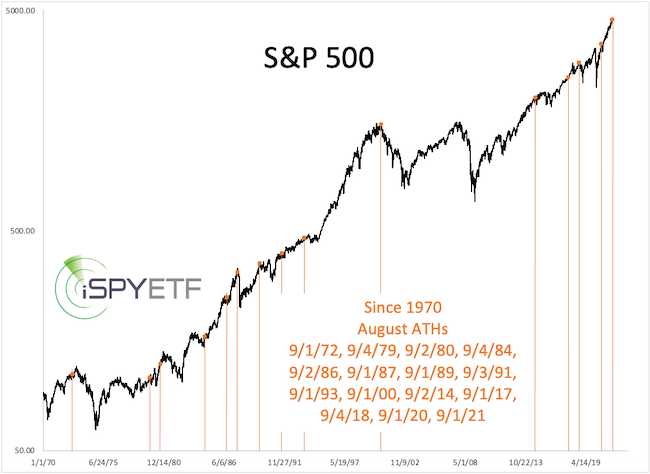
It's tough to cram 50 years of history into one chart, but we can still see that August ATHs preceded some challenging times (i. e. 1972, 1987, 2000, 2014). Let's drill a bit deeper.
The chart below shows the S&P 500 forward performance starting with the first day of September. The 5 instances since 2000 are shown in yellow, the 9 instances prior to 2000 are shown in gray. 2020 (in red) shattered all precedents with the exception of 1986.
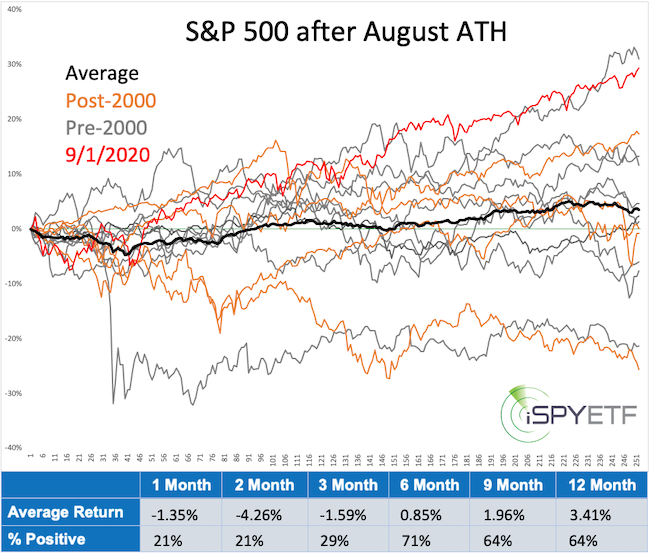
As the performance tracker (bottom table) shows, returns for the next 1 - 3 months have been dismal.
The above study was just 1 of 3 studies published in Monday's Profit Radar Report, which also featured the latest Risk/Reward Heat Map (a visual tool that shows risk based on 100s of studies).
Stocks have been immune to any kind of risk projection so we need price to verify risk with a drop below support.
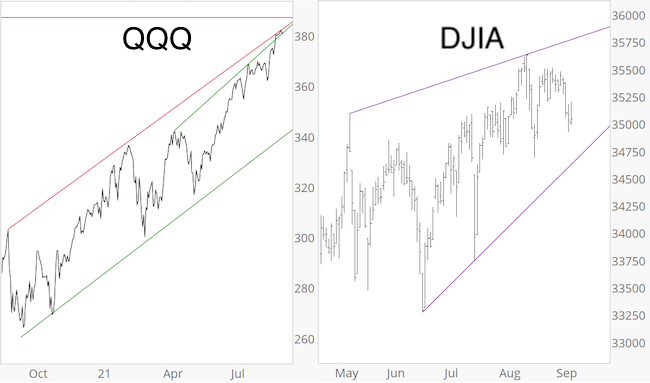
Below are some basic levels to help judge risk and reward. The Nasdaq QQQ ETF is up against resistance. It will take a break above resistance to unlock higher prices (perhaps a blow off top).
DJIA is stuck in a potential wedge. A move above and back below upper wedge resistance would be a warning signal, as would be a good close below the lower wedge line.
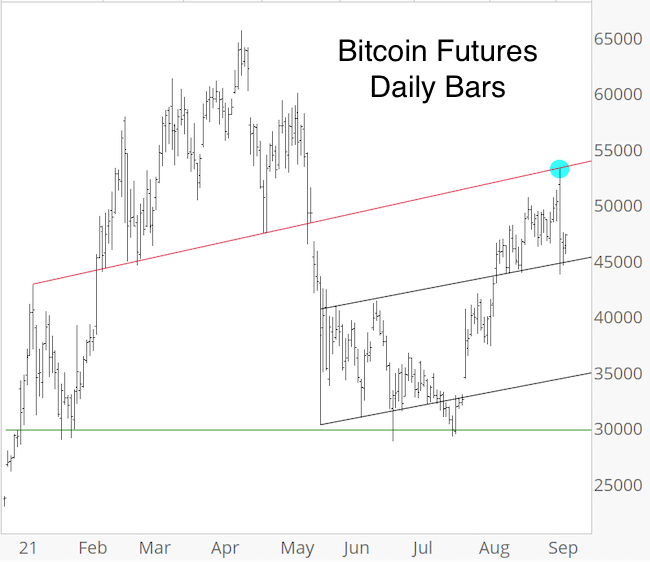
Monday's Profit Radar Report showed the below Bitcoin Futures chart and pointed out that price is against resistance while over-bought, which meant short-term risk was elevated. Within hours, Bitcoin dropped 10,000 points, nearly 20%. This general bias is likely positive as long black trend channel support holds.
Continued updates, out-of-the box analysis and forward performance based on historic precedents are available via the
Continued updates and factual out-of-the box analysis are available via the Profit Radar Report.
The Profit Radar Report comes with a 30-day money back guarantee, but fair warning: 90% of users stay on beyond 30 days.
Barron's rates iSPYETF a "trader with a good track record," and Investor's Business Daily writes "Simon says and the market is playing along."
|
