Even though every major index is marching to the beat of its own drum, it's possible to see a common stock market theme. To help investors understand what's going on, I've published below the entire February 28, Profit Radar Report update (which also includes analysis on gold, Treasuries and TSLA). Please notice how the summary section offers a cohesive forecast despite the market's fragmented nature.
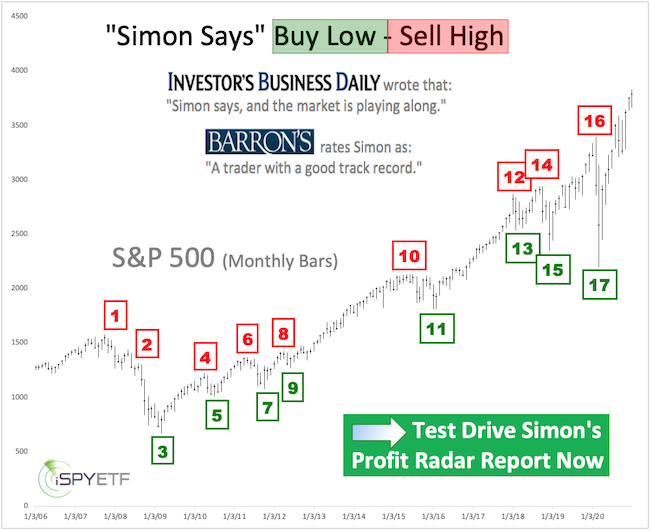
Barron's rates iSPYETF as "trader with a good track record" and Investor's Business Daily says: "When Simon says, the market listens." Find out why Barron's and IBD endorse Simon Maierhofer's Profit Radar Report
Profit Radar Report, February 28, 2021 (5:45pm PST)
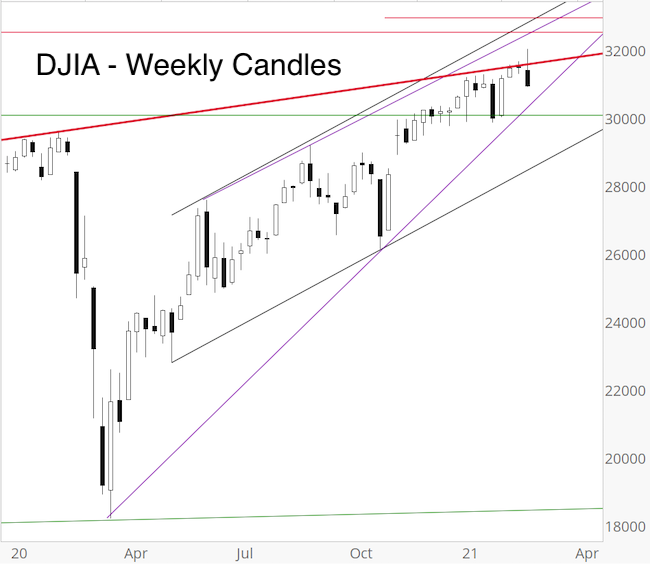
Thursday and Friday delivered a whippy conclusion to the week. DJIA spent Thursday above trend line resistance but relapsed back below it Friday and painted a weekly reversal candle against the trend line.
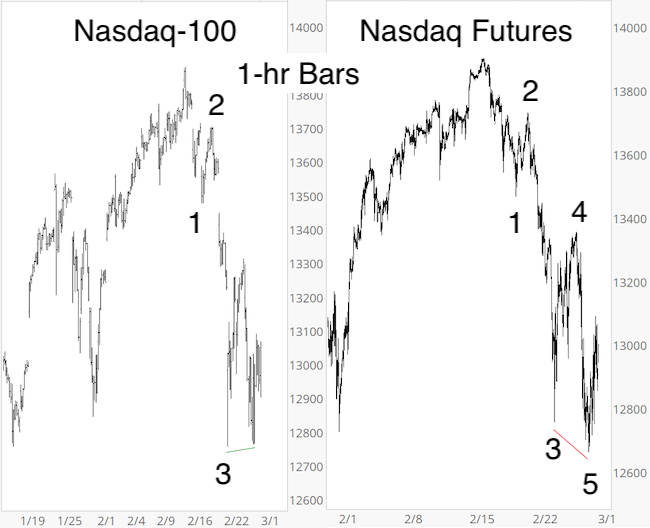
Nasdaq-100: Wednesday’s PRR showed the potential for a 5-wave decline (with wave 4 invalidation level). As the side-by-side comparison below shows, the Nasdaq-100 Futures did set a new low for a legitimate 5-wave decline. The Nasdaq-100 Cash Index however, did not.
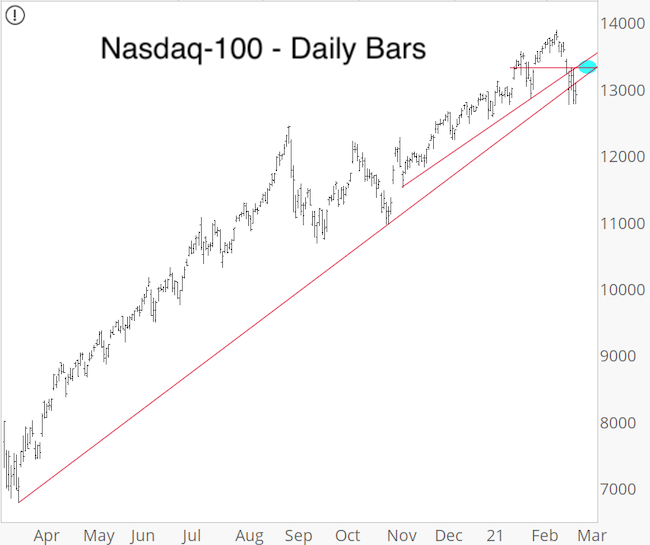
The daily chart shows a break below trend line support. A backtest of the previously broken support (now resistance around 13,300) is quite common. A close back above the resistance cluster (blue oval) will pause any pullback and possibly rejuvenate this rally.
S&P 500 Futures almost tagged the rising trend line from the March low (3,780) on Friday. The blue oval highlights a support cluster at 3,720 - 3,780. The decline from the high looks either like 3 waves (which suggests the pullback is already or nearly over) or a 1, 2 setup (which would point towards down side acceleration once this bounce is complete).
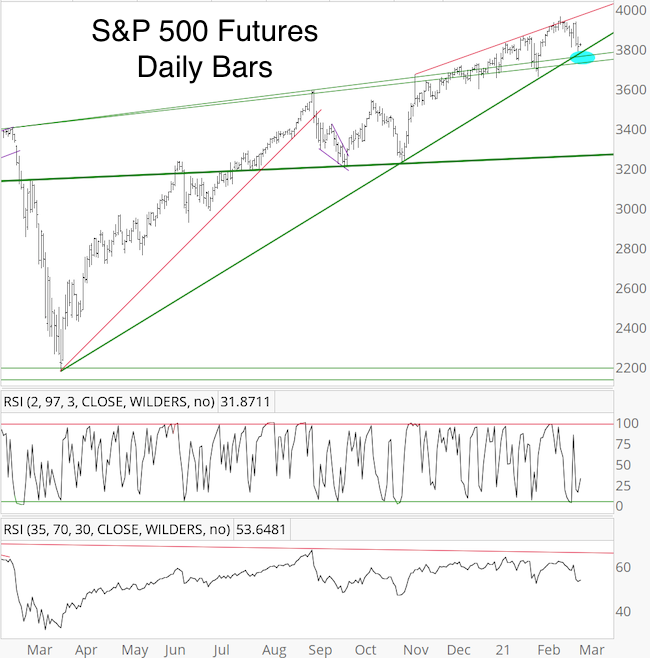
Summary: Every index is marching to the beat of its own drum, and there’s even discord between the same index’ cash and futures chart (Nasdaq). DJIA painted an ugly looking weekly reversal. Nasdaq Futures declined in 5 waves but Nasdaq-100 Cash only in 3 waves (Elliott Wave Theory explains the significance of 3 vs 5-wave moves). S&P 500 (cash and futures) looks like a 3-wave decline and the S&P 500 Futures decline paused at important trend line support.
S&P 500 Futures support at 3,780 held and first-of-the-month liquidity inflows tend to buoy markets, so odds of a bounce to start the week are high. We would prefer for selling to resume after this bounce exhausts (ideally Monday or Tuesday), but a move above 31,600 for DJIA, 13,300 for Nasdaq-100 and 3,900 for S&P 500 could embolden buyers again and rejuvenate the rally.
Gold couldn’t make it above the 1,830 resistance cluster (blue circle, daily chart) last week and continued lower.
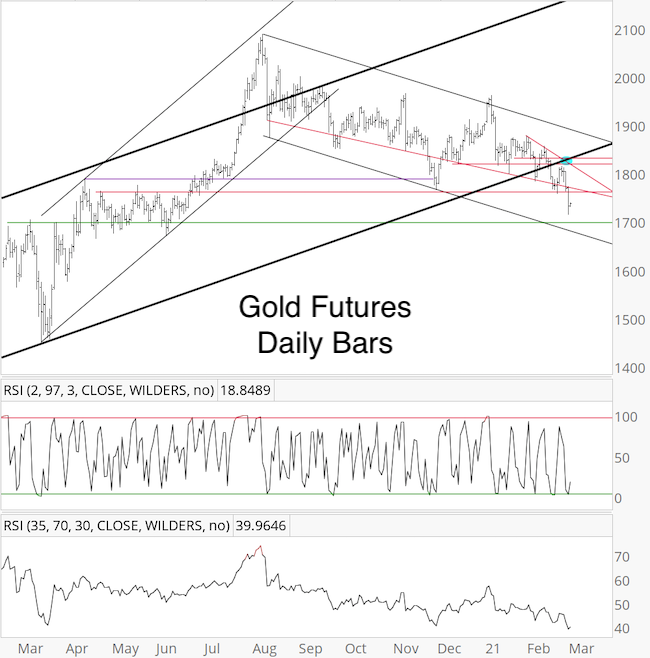
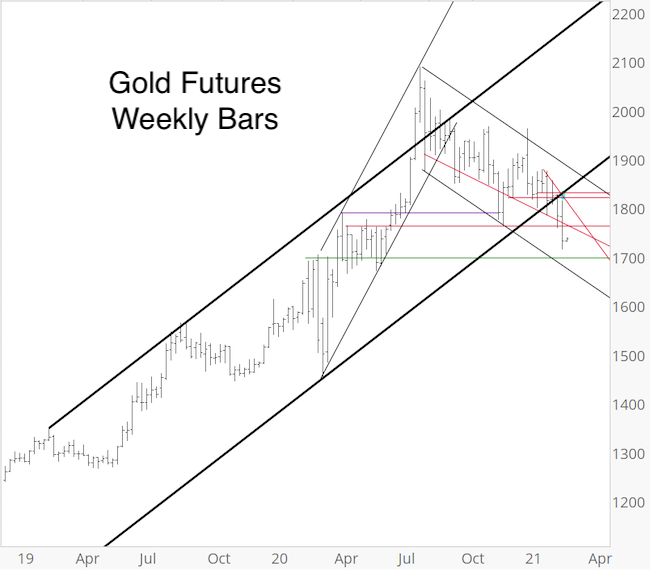
The weekly chart shows strong support in the 1,700 area, which is where the 2020 melt up started. A dip into that zone, if it occurs, would likely spark a bounce. How strong of a bounce is to be seen.
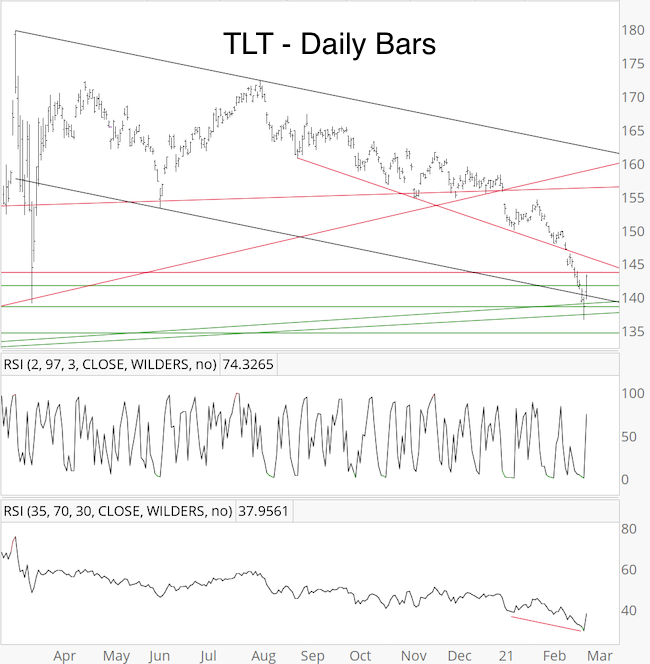
Wednesday’s PRR mentioned that TLT is likely to bounce from the 134 - 140 zone. From Thursday’s low at 136.61, TLT bounced already 2% with futures action suggesting more follow through Monday morning. Initial resistance will be at 143.60 - 146, but the selloff was strong enough to cause an even stronger bounce.
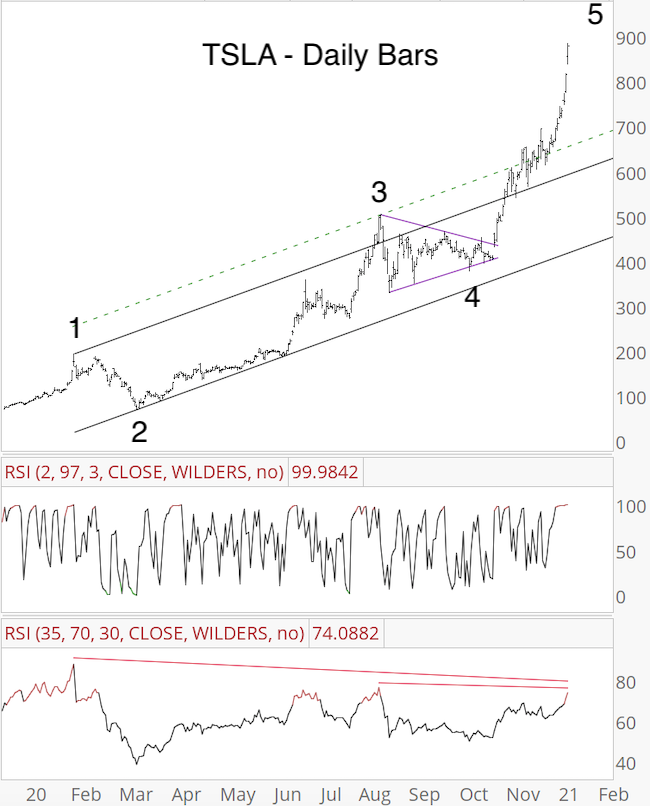
TSLA: The January 10 PRR included the chart and commentary below:
“The next chart shows the most likely Elliott Wave Theory labels. Wave 5 doesn’t have to be over yet, in fact a smaller wave 4 and 5 seems necessary to finish the bigger wave 5. Based on the log scale chart, there is resistance around 900. Will lightning strike twice and TSLA suffer two post-bowl collapses? My gut feeling says no, at least not initially, but perhaps after a brief violation of bowl support and subsequent rally continuation.”
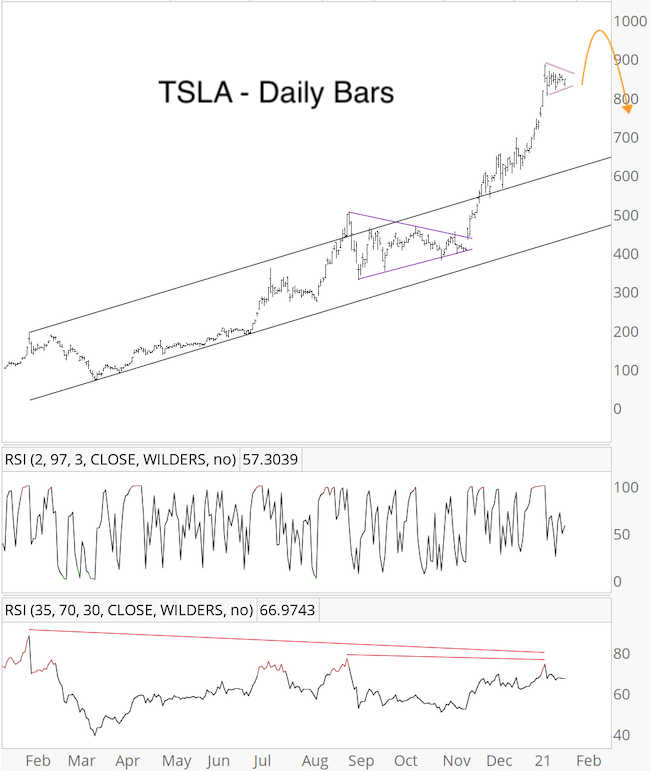
The January 24 PRR followed up with this chart and commentary:
“TSLA paused at 884 and started carving out another triangle, which could be a smaller wave 4 before the last spike into a quickly reversed all-time high (possible resistance in the high 900s, depending on timing).”
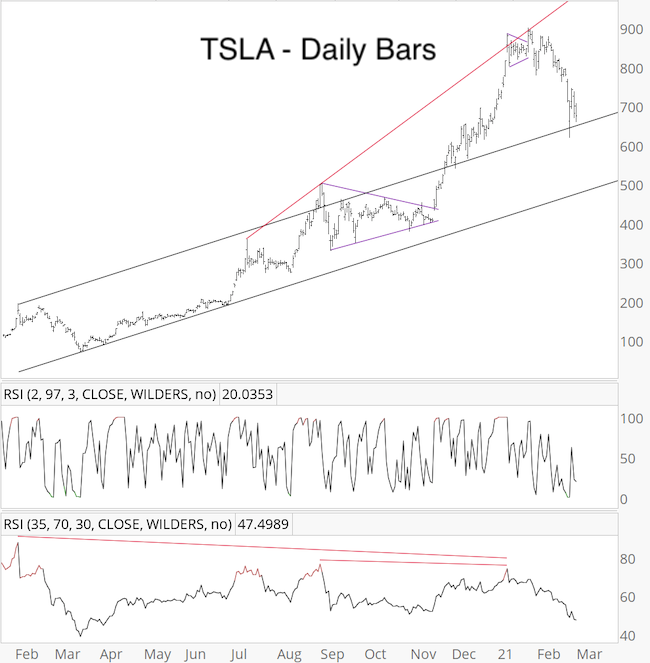
The updates TSLA chart shows a 31% drop from the January 25 high at 900.40, which was a bit lower then expected. Thus far, price has stayed above trend channel support. A break below 607 could lock in a 5-wave decline along with the corresponding implications (counter trend rally followed by eventual new lows), but as long as price stays above, TSLA can still recover.
Continuous updates are available via the Profit Radar Report.
Simon Maierhofer is the founder of iSPYETF and the publisher of the Profit Radar Report. Barron's rated iSPYETF as a "trader with a good track record" (click here for Barron's evaluation of the Profit Radar Report). The Profit Radar Report presents complex market analysis (S&P 500, Dow Jones, gold, silver, euro and bonds) in an easy format. Technical analysis, sentiment indicators, seasonal patterns and common sense are all wrapped up into two or more easy-to-read weekly updates.
|