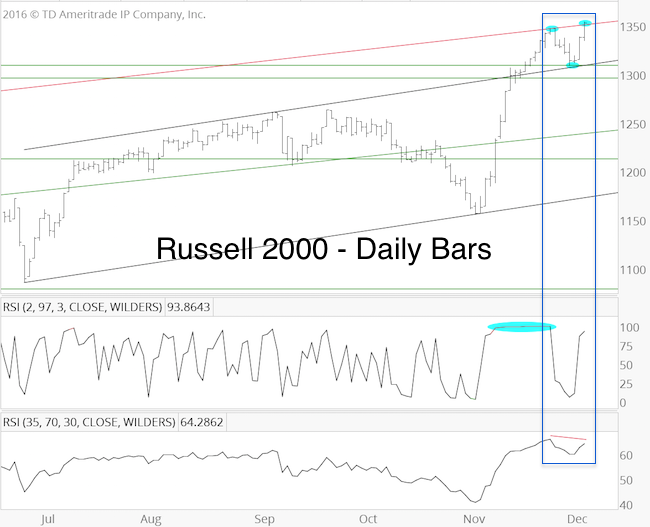
The Russell 2000 has been on a tear. On November 28, the R2K ended a 15-day winning streak when it touched red trend line resistance at 1,349 mentioned by the Profit Radar Report.
Barron's rates iSPYETF as "trader with a good track record" and Investor's Bussines Daily says "When Simon says, the market listens." Find out why Barron's and IBD endorse Simon Maierhofer's Profit Radar Report.
This pullback was to be temporary. The November 30 Profit Radar Report stated that: “The R2k is nearing an oversold condition and strong support at 1,309 – 1,296,” and recommended to buy R2k at 1,305. The corresponding level for the iShares Russell 2000 ETF (IWM) was 129.90.
Now the R2K is back at trend line resistance, but this time it carved out a bearish RSI divergence. There was no such divergence on November 25, which strongly suggested new all-time highs.
If you enjoy quality, hand-crafted research, >> Sign up for the FREE iSPYETF Newsletter
Bearish RSI Divergence, a Red Flag?
Under normal conditions, this bearish RSI divergence would be a serious red flag. However, the November 13 Profit Radar Report included the following observation:
“The DJIA and Russell 2000 ended the week overbought, which normally will cause a pullback. However, if the S&P is truly in a wave 3 advance, stocks will continue to plow higher without much letup.”
The Russell 2000 has plowed higher ever since. The unique condition that allows for continuous gains despite on overbought condition is discussed here: S&P 500 Update – Expect the Abnormal?
Here is another statistic in favor of higher prices: Since 1979, there’ve been 12 other times when the R2K rallied at least 12 days in a row. A month later, the R2K was higher 10 times. 3 month later, the R2k was higher 7 times. 6 months later the R2k was higher 10 times.
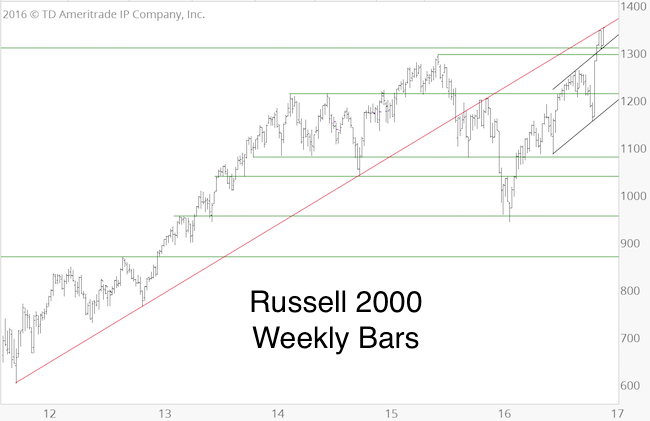
The chart above provides long-term context for the R2K. The red trend line going back to 2011 is obvious resistance. If (and as long as) the R2K is able to sustain a break above this line, it may just continue higher.
Until it does, some caution is warranted.
Continuous updates for the Russell 2000, S&P 500 and other asset classes are available via the Profit Radar Report.
Simon Maierhofer is the founder of iSPYETF and the publisher of the Profit Radar Report. Barron's rated iSPYETF as a "trader with a good track record" (click here for Barron's profile of the Profit Radar Report). The Profit Radar Report presents complex market analysis (S&P 500, Dow Jones, gold, silver, euro and bonds) in an easy format. Technical analysis, sentiment indicators, seasonal patterns and common sense are all wrapped up into two or more easy-to-read weekly updates. All Profit Radar Report recommendations resulted in a 59.51% net gain in 2013, 17.59% in 2014, and 24.52% in 2015.
Follow Simon on Twitter @ iSPYETF or sign up for the FREE iSPYETF Newsletter to get actionable ETF trade ideas delivered for free.

If you enjoy quality, hand-crafted research, >> Sign up for the FREE iSPYETF Newsletter
|
