Enjoy the Profit Radar Report's full 2023 S&P 500 Forecast published on January 31, 2023:
The full year S&P 500 forecast is my biggest project of the year, and quite frankly it’s kind of a thankless job. Why? It gives every critic a documented, black and white foundation for criticism.
It is impossible to predict a full year of stock market future, that's why market forecasts are loaded with ‘ifs,’ “buts,’ and other ambiguities. Anyone attempting to predict the unpredictable is bound to miss the mark.
That’s why no other newsletter (at least none that I’m aware of) publishes an actual full year S&P 500 chart projection. Accountability is an under appreciated (if not entirely ignored) concept on Wall Street. But what’s the purpose of following many time-tested indicators if we don’t put them to work?
As subscriber, you deserve a straight-forward forecast. My goal is to provide a rough roadmap for the year ahead based on what indicators are telling us right now (updates will be added at the bottom of this forecast as more information becomes available).
Sincerely,
Simon Maierhofer
Table of Contents
-
2022 Review
-
Supply & Demand, Breadth
-
Support/Resistance Levels
-
Elliott Wave Theory
-
Inflation
-
Socioeconomic Peace & Prosperity
-
Investor Sentiment
-
Seasonality & Cycles
-
S&P 500 Barometers
-
Valuations
-
Money Flow
-
Risk/Reward Heat Map
-
Summary
-
2023 S&P 500 Projection
2022 Review
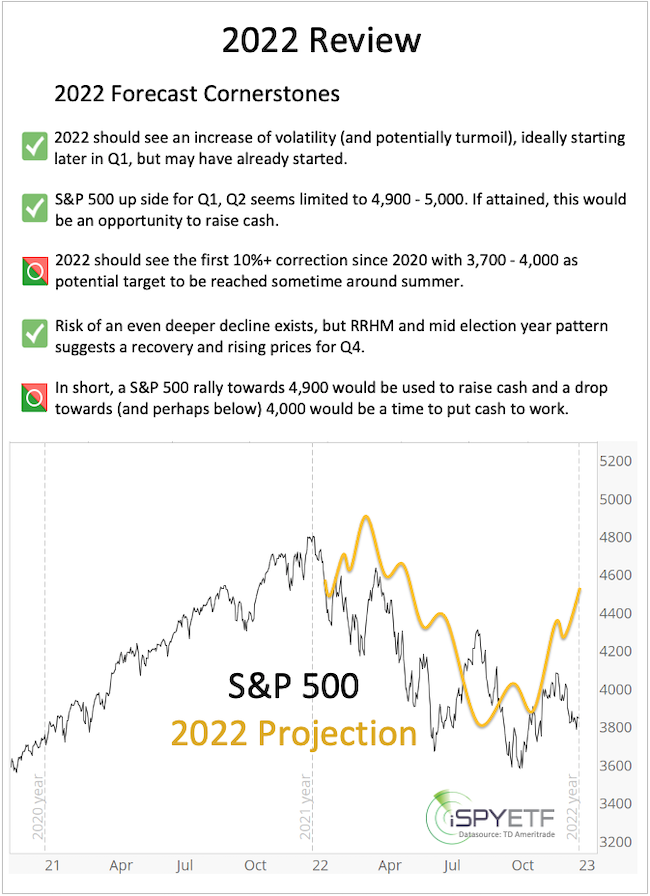
A majority of indicators flashed warning signs last year at this time. Copied below are a few mentioned in the 2022 S&P 500 Forecast:
-
“The bearish divergence (NY Composite a/d lines) reappeared again at the January 2022 S&P 500 highs. This internal market deterioration is a concern and a warning sign.”
-
“The 6-month average of Titanic signals exceeded 25. It's been a good bear market indicator. Although the majority of breadth studies are positive, this is one that should not be ignored.”
-
“We’ll focus on the commonality of all 3 (Elliott Wave Theory) scenarios: Up side is limited and down side risk is increasing.”
-
"Trend line resistance is around 4,915. We do not expect the S&P to break above this trend line in 2022."
-
“Short-term, the January 10, 2022 low at 4,582 is important. Failure to hold above this level would be a warning signal with the potential for a quick drop into the 4,200 - 4,300 range. If the 4,200 - 4,300 support zone fails, a test of the 4,000 zone (as low as 3,700) is possible.”
-
“2022 is the mid election year, which is the weakest of the 4-year presidential election year cycle. Historically (going back to 1950), the S&P 500 declines on average about 20% into the mid-term election year low.”
-
“Since the Fed is planning to unwind and reduce purchases (and shrink its balance sheet) in 2022, the risk of a more serious correction this year is much greater than in 2021.”
The S&P 500 projection for 2022 (yellow line) expressed the expectation for a drop to about 3,800. However, prior to descending lower, the S&P fell just short of the 4,900 - 5,000 target range (last all-time high was 4,818.62), which was the maximum expected up side and place to sell stock holdings.
Below as a comparison of the 2022 Forecast Cornerstones and the 2022 S&P 500 projection with what actually happened.
S&P 2023 Forecast
The 2023 S&P 500 Forecast is based on the "4 Engines of Market Forecasting" and the Risk/Reward Heat Map (RRHM).
-
Supply & Demand
-
Technical Analysis
-
Investor Sentiment
-
Seasonality & Cycles
-
Risk/Reward Heat Map (derived from above components)
Supply & Demand, Breadth
Cumulative NY Composite Advance/Decline Lines
The “How to Discern a Major Market Top” report explains the NYC and NYC OCO a/d lines and how we’ve successfully used them.
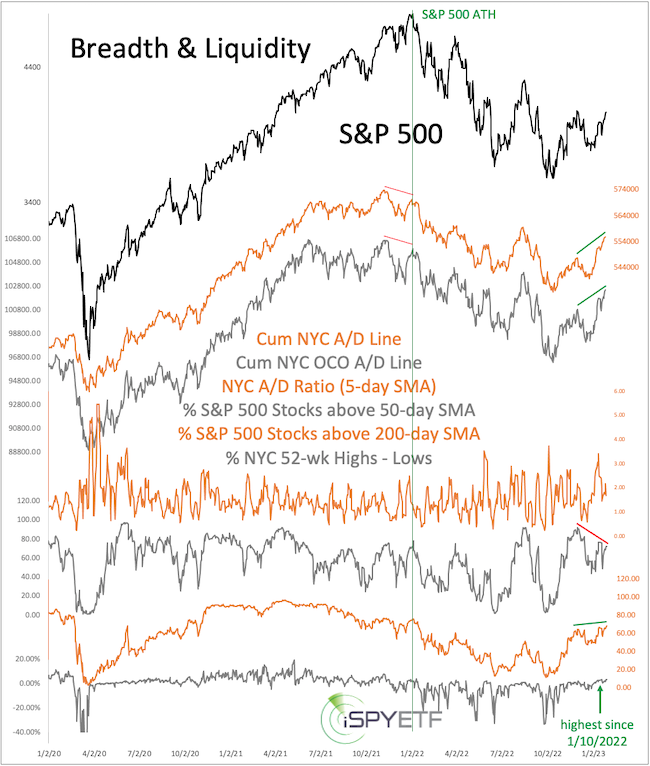
The bearish divergence seen at the January high (and highlighted in the 2022 S&P 500 Forecast) was a timely warning signal of what was to come. Unfortunately, prior to the January divergence, the autumn 2021 divergence (the longest since 1998) was a fake out, which somewhat diluted the warning message of the January divergence.
Still, the NYC and NYC OCO a/d lines did their job and correctly foreshadowed market weakness. The divergences, however, do not tell us the extent of the ultimate stock market losses. Since the top has come and gone, we will now turn our attention to assessing odds of a bottom.
We will now look for signs of strength that may suggest a bear market low is in place and/or if new all-time highs could be on the horizon (see June 7, 2020 PRR, February 18, 2019 PRR, July 4, 2016 PRR for historic studies like that).
Breadth has been very positive and the ratio between advancing and declining stocks got as high as 3.39 on January 12 (5-day SMA, 3.39 stocks advancing for each declining stock). The cumulative advance/decline lines already exceeded their December highs (even though the S&P 500 has not yet) and the net number of 52-week highs is the highest since January 10, 2022.
Although there hasn’t been a particularly dense cluster of 90% or 80% up days (which we usually look for), multiple lesser known breadth thrusts (as defined by Walter Deemer or Wayne Whaley) triggered the first two weeks of January. This is rare, and forward performance after past signals has been exclusively positive.
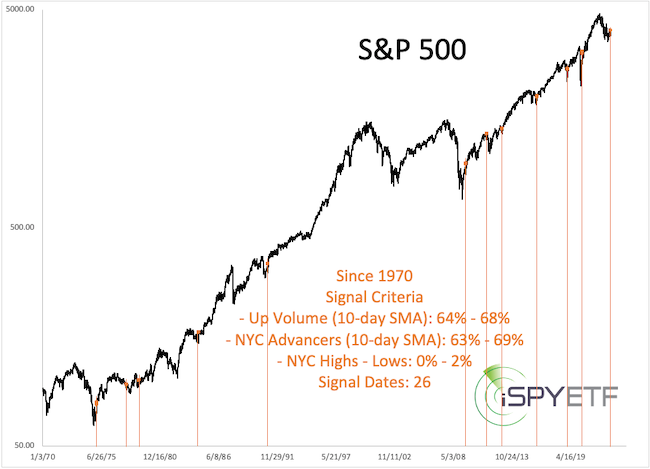
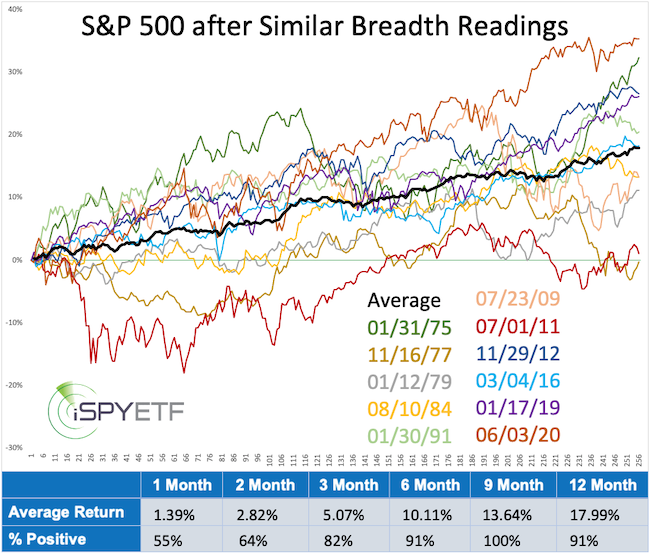
When we search for breadth readings very similar to mid-January (based on 10-day SMA of advancing stocks, advancing volume, and net new 52-week highs) we get only 11 prior signals. The exact criteria and and signals dates are shown below.
Forward performance has been remarkable. After a somewhat rocky first couple months, the S&P 500 was up every time 9 month after the signal with an average gain of 13.64%.
Unfortunately there is a caveat: A number of normally reliable breadth studies - that either signaled wash out or break out conditions - failed in late 2021 and throughout 2022 as stocks continued to grind lower. Despite this caveat, breath strongly cautions against taking a blindly bearish stand and supports to lean bullish.
Support/Resistance Levels
Support: At the October 2022 low (3,491.58), the S&P 500 almost tagged long-term support (green circle). This trend line will continue to be support (ascending, currently around 3,500), followed by the February 2020 high (3,393.52). The minimum target for the expanding diagonal, which is hanging on by a thread (purple lines, revisited in the January 8 PRR), is at 3,323.
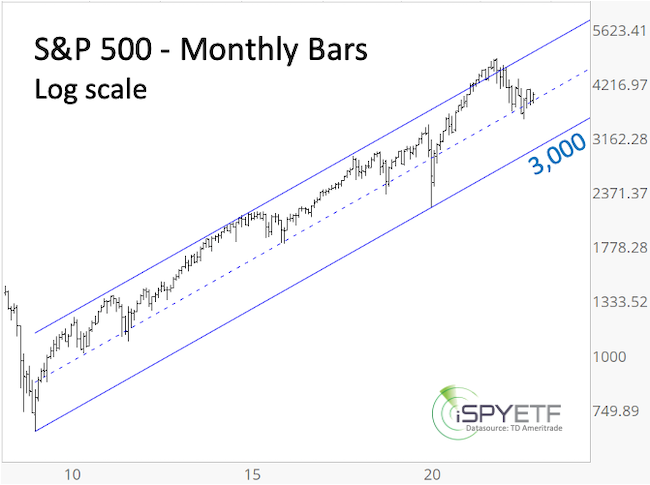
Support of the blue long-term channel shown via the log scale chart is around 3,000.
Short-term, the breakout level above the purple diagonal resistance line (3,990- 3,950) is important support.
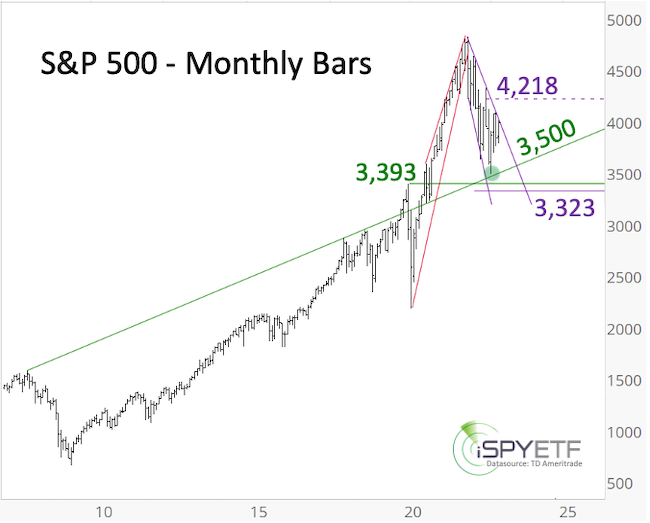
Resistance: The decline from the January 2022 high follows an overlapping lower high, lower low pattern. Each prior high serves as resistance (4,100.96, 4,325.28, 4,637.30). By itself those levels are not incredibly important. However, based on Elliott Wave Theory (EWT), a move above each of those levels creates either an overlap that decreases the odds of a continued bear market or eliminates a bearish 1-2, I-II set up where a strong wave 3 decline could be next.
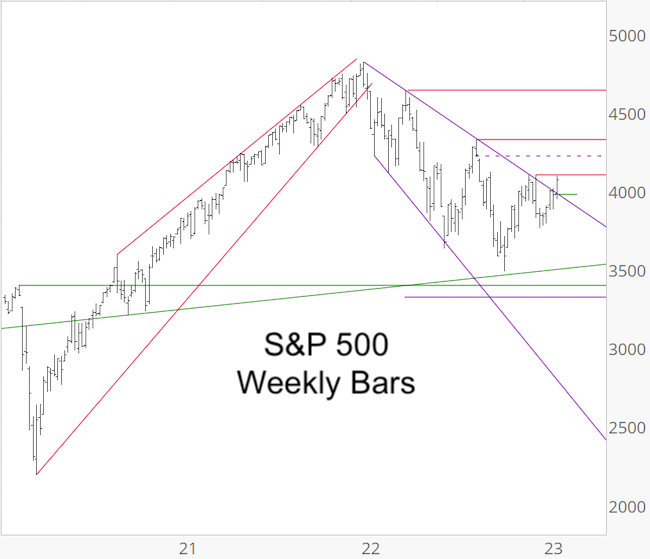
Chart gaps: Every single down side chart gap since the 2009 low has been closed. Knowing this has kept us bullish many times when others turned bearish (i.e. in 2020, 2018, 2015). Right now there is still an open chart gap at 4,218.17, and we expect this gap to be closed at some point. There is also on open chart gap for DJIA at 36,044.22.
Elliott Wave Theory
The basics of Elliott Wave Theory (EWT) are explained here.
Every indicator waxes and wanes in terms of effectiveness. EWT has been on a waning cycle (decreasing effectiveness). Perhaps that’s due to algo trading, fed intervention, or EWT getting too popular for its own good.
Fact is, patterns have been ambiguous for much of the past few years and analyst interpretations and projections have been all over the place (quite frequently diametrically opposed). EWT can still be helpful, but one has to be selective, discerning and most of all open minded to the weight of evidence.
The 2022 S&P 500 Forecast featured the 3 most likely EWT scenarios and stated that: “The rally from the March 2020 low is sloppy and can be interpreted in various ways. Although the scenarios are labeled #1, #2, #3, this year it does not mean that scenario #1 is more likely to play out than scenario #3. Instead, we’ll focus on the commonality of all 3 scenarios: Up side is limited and down side risk is increasing.”
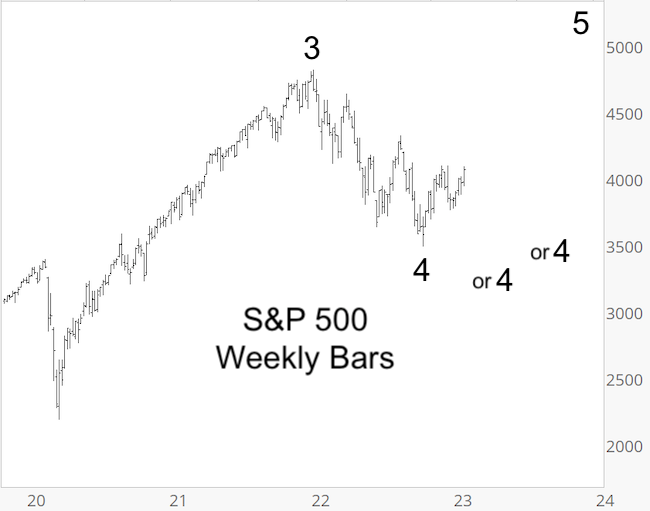
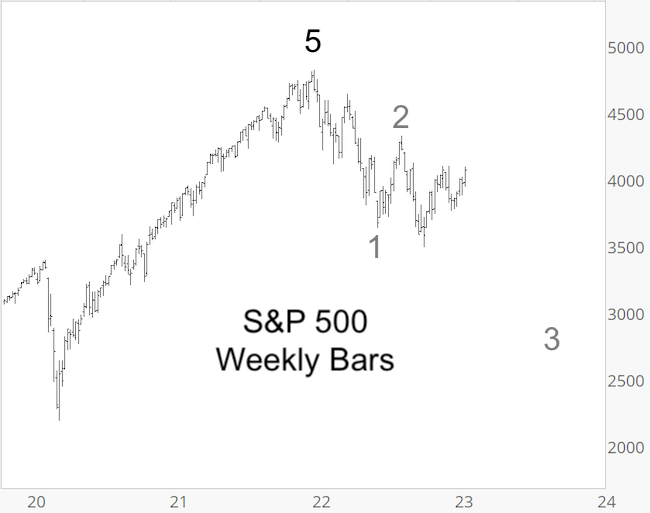
Up side was limited and risk certainly increased very early in 2022. However, the pattern of the decline from the January 2022 high is, once again, up to interpretation. It could be a sloppy 5-wave decline (indicative of a change of trend) or a 3-wave decline (indicative of a correction followed by new all-time highs).
The expanding diagonal (purple lines, see January 8, PRR) was one valid way to consider the decline from the all-time high as developing 5-wave structure. However, the move above the upper purple line and close vicinity to 4,100 puts this pattern on very thin ice.
This forecast will not list all the EWT interpretations in circulation. Rather, the chart below lumps the different variations into two categories:
-
The 2022 decline is part of a correction (wave 4) that will eventually be followed by new all-time highs. Waves 4 are notoriously choppy and hard to predict. Wave 4 could already have ended at the October low or it could drag on for many more months. Regardless, the down side would be limited to somewhere around the October 2022 low.
-
The 2022 high is the end of the bull market (wave 5). A bear market is unraveling with the worst part of the bear market (wave 3) likely to be seen in 2023. This scenario is possible and we will watch for tell-tale signals, but based on the weight of evidence it is less likely than scenario #1.
Inflation
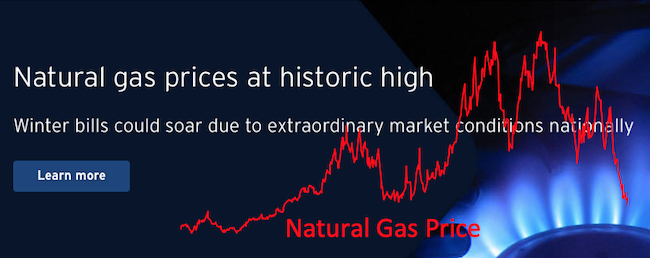
The SDG&E (local power company) homepage has been displaying the following message:
Natural gas prices at historic high. Winter bills could soar due to extraordinary market conditions nationally.
The message banner is also shown below. What SDG&E does not reveal, but everyone should know, is the actual gas price chart (plotted on top of it, in red). Gas prices are not at historic high anymore, that was 6 months ago. Since then, gas prices are down some 70%. Yet, gas and electricity prices (at least for us here in San Diego) went up again effective January 1, 2023.
This is just one of many anecdotal but painful examples of rising prices. Inflation is real, and it’s almost become ‘socially acceptable’ for big and small businesses alike to raise prices. However, the rate increase to the consumer is often not commensurate to the price increase of the underlying goods. I venture to say that business not only pass on their higher costs but also bake in a higher profit margin. Ironically the economy is still good enough to where almost every business seems to get away with it (at least here in San Diego).
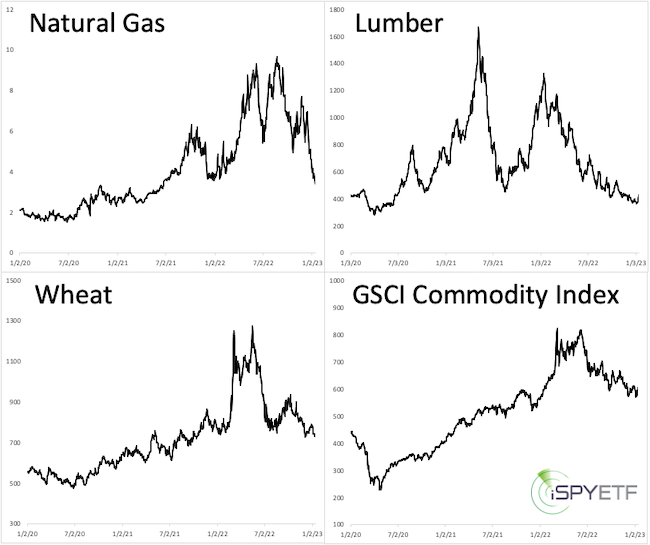
The scenario of falling commodity prices (see chart below) but higher retail prices, mentioned in the March 6, 2022 PRR, is playing out. Stagflation (inflation rising faster than economic growth) is the label many use to describe the current economic environment.
I personally have been very hesitant to predict a recession. That doesn’t mean it won’t happen, but here in San Diego it’s difficult to find a cleaner for our vacation rental property for less than $45/hour. Restaurants are struggling to find entry level help for less than $20/hour. Whole Foods had their smoked meats department closed down for weeks because of staff shortages. How bad can the economy be if workers don’t feel like they need to work?
Stagflation will likely be the default mode until the economy gets bad enough that workers compete for work instead of employers having to compete for workers. Once this happens, deflationary forces should become more pronounced.
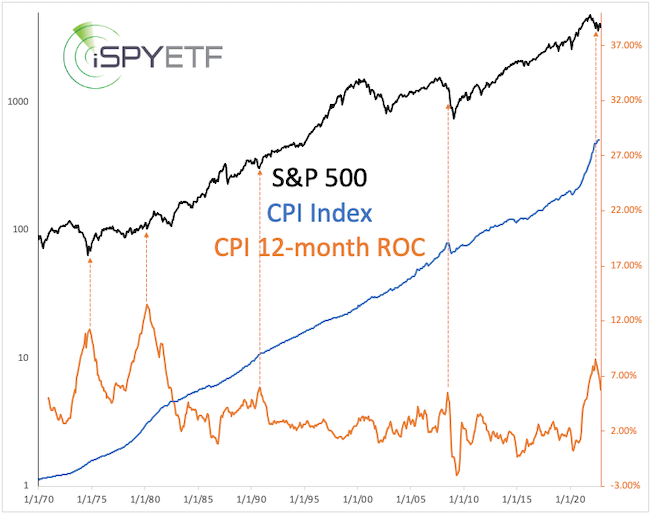
For now, the chart below plots the Consumer Price Index (CPI) and the 12-month change of the CPI against the S&P 500. Based on the past 50 years, it's tough to make the argument that high inflation is detrimental for stocks.
Socioeconomic Peace & Prosperity
This is a new addition to the Forecast. Socioeconomic relates to social and economic factors. Due to supply shortages and conflicts of various sorts (armed and unarmed) in many parts of the world, we are a no longer enjoying the level of peace and prosperity experienced much of the 21st centry (prior to the pandemic).
There are various aspects to peace and prosperity and not every aspect is impacted. In broad strokes, however, it looks like ‘the good and prosperous times’ (aka 2012 - 2020) are a thing of the past, unlikely to reappear in the foreseeable future. More disruptions and waiting times on certain goods may become the new normal.
Investor Sentiment
Below is the Sentiment Picture for January. The Sentiment Picture is published once a month and available in the Special Reports section.
We adopted a new Sentiment Picture format in June 2021, one with a focus on future performance. This format is explained in the June 2021 Sentiment Picture.
As usual, rising stock prices also buoyed investor sentiment, with some indicators (CBOE equity put/call ratio, sentiment combo, % of bullish II and NAAIM respondents) showing the most optimism since August 2022. August ended up being a bear market high followed by another leg down. Could the same thing happen again?
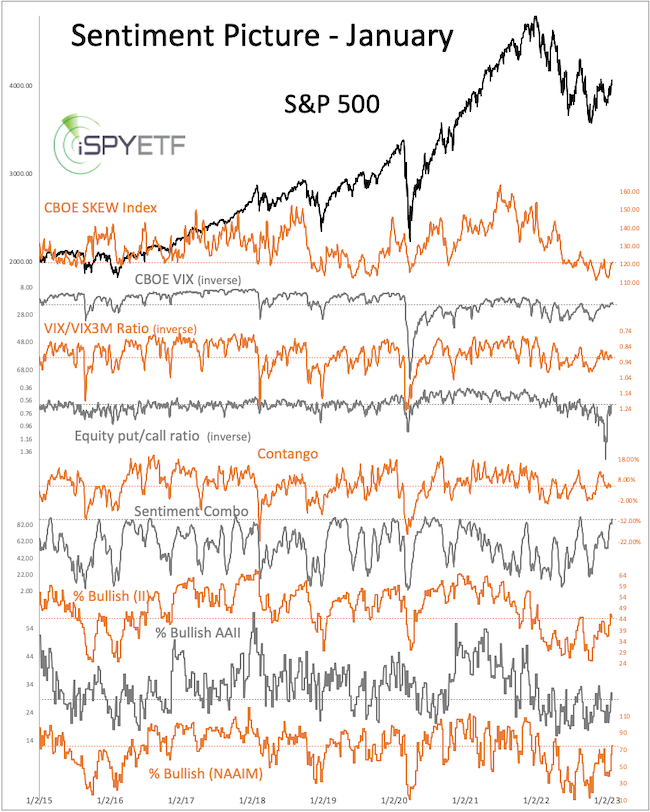
It’s possible, but it’s by no means necessary. As the September 25, 2022, Sentiment Picture brought out: “Some sentiment gauges are already at pessimistic extremes, others are getting close. Based on sentiment, the decline should be nearing its final innings.” Based on sentiment, the bear market could have ended at the October low.
The chart below highlights signal dates similar to the most recent readings:
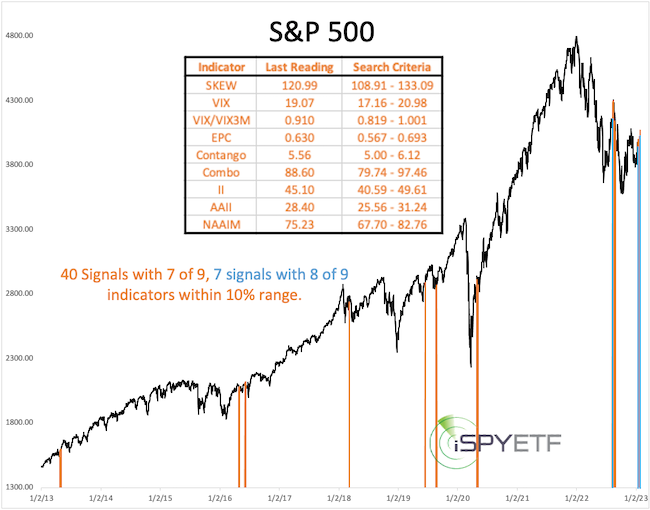
Forward returns are a mixed bag. So, what does the Sentiment Picture tell us? Current readings can appear near bear market highs or bull market kick off phases. The sentiment extremes present during the 2022 lows do allow for a bear market low to be in place.
Seasonality & Cycles
The 2022 S&P 500 Forecast stated: "2022 is the mid election year, which is the weakest of the 4-year presidential election year cycle. Historically (going back to 1950), the S&P 500 declines on average about 20% into the mid-term election year low.
The following year (the pre election year, 2023) is the strongest year of the election year cycle as incumbent presidents prime the pump to increase the odds of reelection. Historically, the S&P 500 gains on average about 50% from the mid election year low to the pre election year high.
Cycles project a fair amount of political and economic turmoil starting in Q1 of 2022. Based on seasonality and cycles, 2022 will be a tough year to navigate where high stocks prices early in the year should be used to raise cash for a better buying opportunity later in the year."
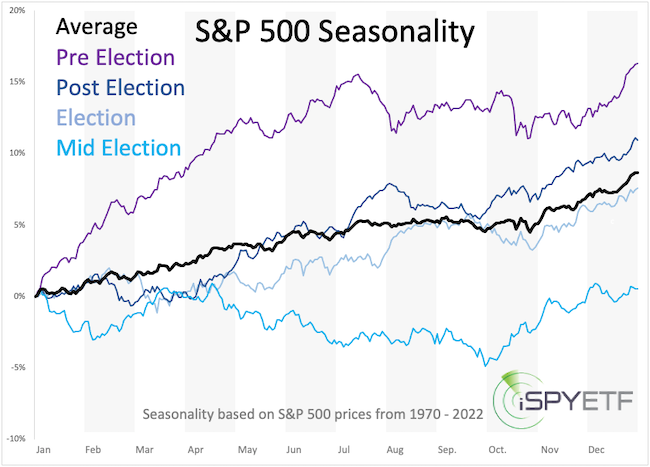
Shown below is the average performance for the 4 different years of the election cycles. We are now in the pre election year, which tends to sport the best performance.
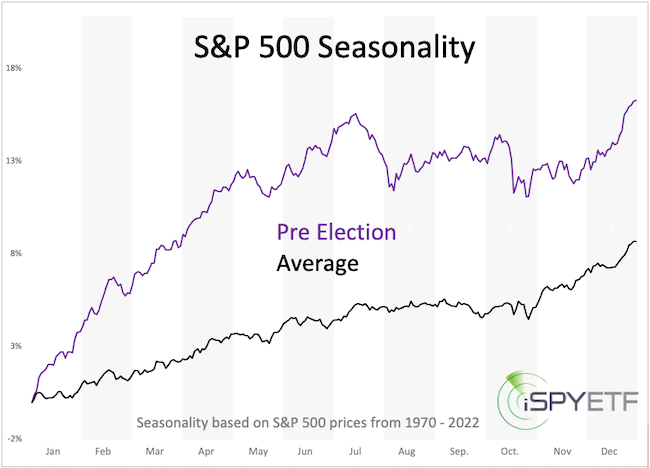
The next chart shows only the average S&P 500 seasonality along with the pre election year seasonality.
Unlike seasonality, cycles project more risk for much of 2023 with rallies in between.
The S&P 500 is up 13.8% since the October low. This is a respectable bounce, but a 50% rally (average gain from mid election low to pre election high) projects 5,365.
A S&P rally beyond 5,000 is not impossible, but ambitious and seemingly unlikely based on the global picture. It is possible that bullish pre election seasonality will be counterbalanced by negative cycles to create more of a neutral balance.
All available seasonality charts can be viewed here.
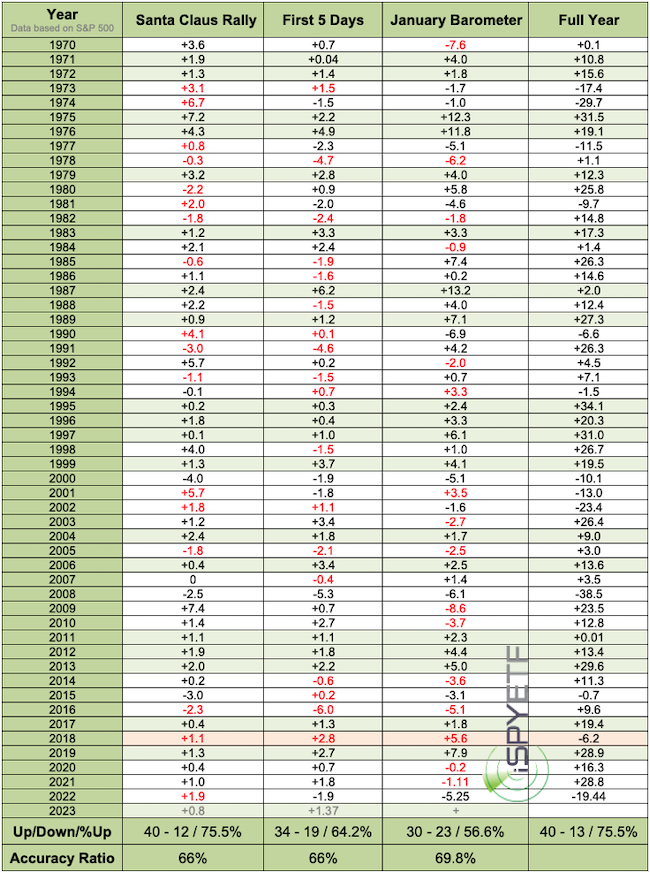
S&P 500 Barometers
The Santa Claus Rally (SCR) delivered a 0.8% gain, the First 5 Days of January (F5J) a 1.37% gain, and the January Barometer (JB) is likely to show a positive result as well. A detailed explanation of the year ahead barometers is available here.
Since 1970, the SCR, F5J and JB were all positive 20 other times. 19 times, the S&P 500 finished the year in positive territory (highlighted in green), once (2018, highlighted in orange) with a loss. Based on these barometers, there’s a 95% chance the S&P will end 2023 with a + before the final return figure.
Valuations
The 2021 S&P 500 Forecast was the first one to comment on valuations. Why? Because many analysts warned that sky-high valuations will cause a crash. The Profit Radar Report didn’t disagree with sky-high valuations, but outlined 3 reasons why a crash was unlikely (Fed balance sheet, low interest rates, difficulty to peg fair value). The S&P ended 2021 with a 28.9% gain, so the 3 reasons obviously trumped valuation concerns.
Things, however, changed last year. The 2022 S&P 500 Forecast warned that: "Since the Fed is planning to unwind and reduce purchases (and shrink its balance sheet) in 2022, the risk of a more serious correction this year is much greater than in 2021."
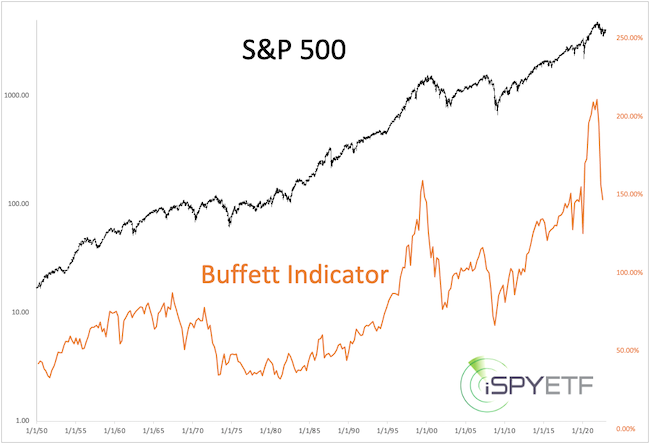
Below is an updated chart of the Buffett Indicator. The 2022 correction certainly reset valuations. Time will tell if the reset was sufficient enough for a major bottom, but valuations do not require a further stock market decline.
Money Flow
In coming years I expect US equities to benefit from the 'in the land of the blind the one-eyed man is king' effect. What's that? The 2021 S&P 500 Forecast explained it as follows:
"In terms of global money flow, what are superior alternatives to US stocks? Europe is not attractive (European Central Bank is more hand-cuffed than the Federal Reserve to further stimulate Europe’s economy). Distrust in government is a global mega trend, with various government bond markets (especially Europe and Japan) being mainly supported by governments buying their own bonds. The US Treasury market may just have carved out a key reversal and perhaps major market top (which of course maybe postponed by today’s announcement to essentially resurrect QE and buy $700 billion worth of assets). In the land of the blind, the one-eyed person is king.”
This is a mega theme likely to develop over many years, and there will be ebbs and flow to this thems. In general however, this money flow theme is a positive for US equities and should soften declines and enhance rallies.
Risk/Reward Heat Map (RRHM)
The Risk/Reward Heat Map (RRHM) was introduced December 2019 (December 11, 2019 PRR) and correctly foreshadowed increased risk for January/Februay/March 2020 and high reward thereafter. The RRHM did not project high risk for 2022.
A detailed introduction to the Risk/Reward Heat Map (RRHM) is available here.
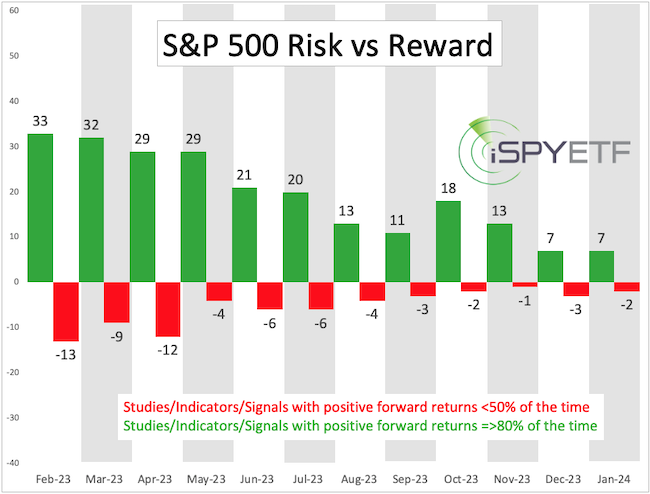
Shown below are the bullish and bearish ‘pressure points’ projected by the indicators, studies, signals (ISSs) analyzed.
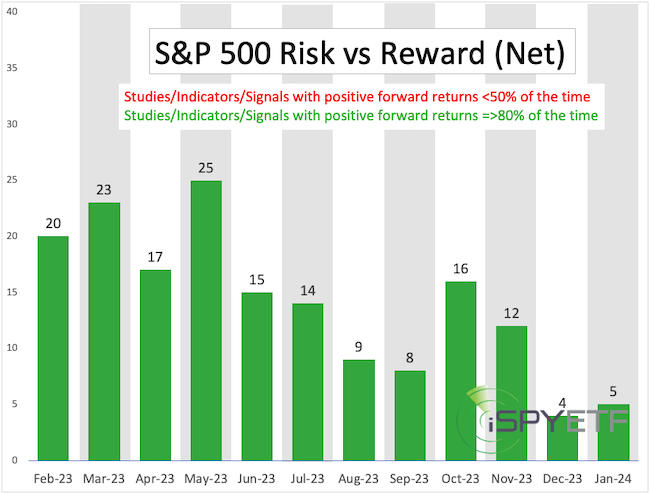
Shown next is the net (risk - reward), which is bullish.
Throughout much of 2022, the analyzed studies (there were 266 different ones) delivered a mixed message. Many breadth and sentiment based studies (especially when the S&P was near lows) projected positive forward returns. Studies based on economic indicators, however, projected largely negative returns.
Due to this contradiction we have not referred much to the RRHM. Instead, we've adopted a 'keep it simple' approach based on carefully chosen support and resistance levels. This has guided us well for the second half of 2022. Even if not mentioned during regular updates, the RRHM continues to be calculated.
The RRHM is integral and the best way for me to keep a pulse on the market and be aware of develpments all throughout the indicator universe.
Summary
Here are the key takeaways from the indicators discussed above:
-
Short-term, the bias is up as long as the S&P stays above 3,950.
-
If the S&P can break above 4,100, the next resistance and inflection zone is at 4,218 - 4,350.
-
Inflection zones are likely to cause a reaction (turn down or turn up price), but unless key support is broken, the S&P could move towards the 2022 all-time highs.
-
There is an open DJIA chart gap at 36,044 (5.7% above current price), which likely will be closed at some point.
-
Seasonality, breadth, S&P 500 barometers, sentiment and breadth-based studies suggest higher prices. The bearish EWT scenario, cycles, economic indicator-based studies suggest lower prices. These forces may neutralize each other, leaving a small bullish bias.
-
We do not expect a S&P 500 break below support at 3,500 - 3,300.
-
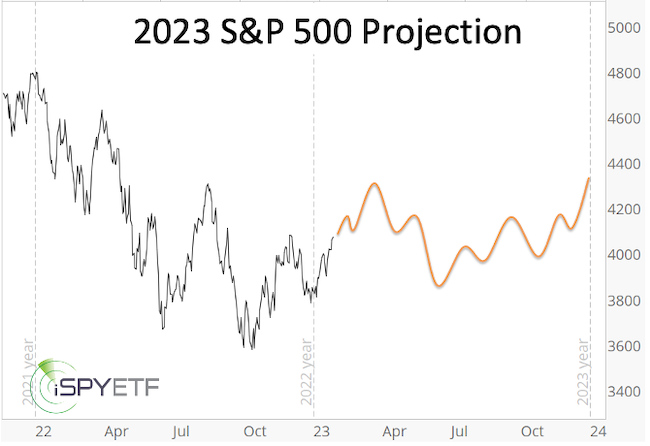
The overall range bound 2023 S&P 500 projection reflects our positive bias tempered by the tug of war between conflicting indicators and money flow forces. A break above resistance (4,350) or below support (initially 3,750) is needed for a potential break out or break down.
2023 S&P 500 Projection
Continued updates are published in the Profit Radar Report section.
|
