On Wednesday, January 27, 2021, the VIX soared 61.64%, which was the 3rd biggest daily spike ever.
3rd biggest spike in history is already pretty remarkable, but it doesn’t stop there. Interestingly, after similar occurrences, the S&P 500 carved out one of two general patterns.
Raw, Interesting Data
To evaluate last week’s unique action in the context of history, I’ve identified all days the VIX gained 40% or more. All dates are listed in the table below. The data in the right set of columns is sorted by daily VIX percentage change.
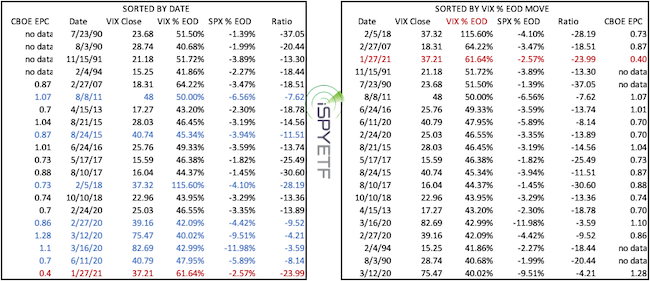
The left set of columns is sorted by date and includes one additional filter: Days where the VIX closed above 30 (like on 1/27/21). Those days are highlighted in blue.
The chart below provides a visual for only the ‘blue dates.’ It shows the percentage VIX change (blue bars), percentage S&P 500 change (red bars), the S&P 500/VIX ratio (blue bars) and CBOE equity put/call ratio (yellow bars).
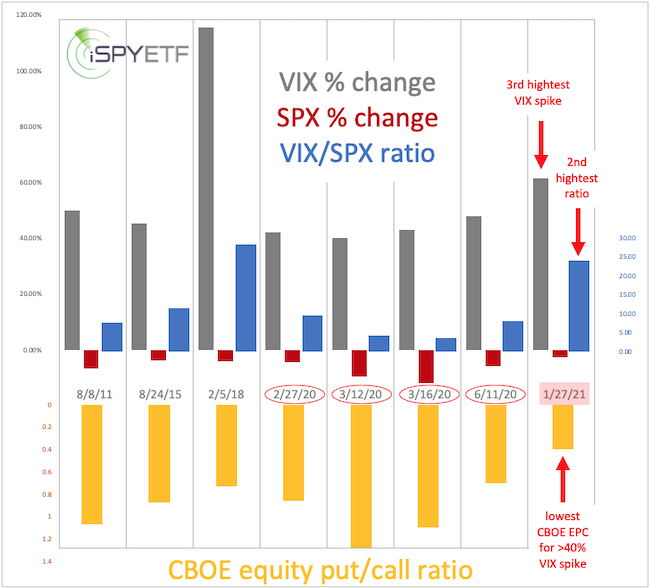
On 1/27/21, the CBOE equity put/call ratio was 0.40. The average CBOE equity put/call ratio after a 40% daily VIX spike is 0.89. The average CBOE equity put/call ratio after a 40% daily VIX spike when the VIX closed above 30 (as on 1/27/21) is 0.94.
Barron's rates iSPYETF as "trader with a good track record" and Investor's Business Daily says: "When Simon says, the market listens." Find out why Barron's and IBD endorse Simon Maierhofer's Profit Radar Report
I have CBOE equity put/call ratio going back to the year 2000, and in the 21st century, the CBOE equity put/call ratio has never been that low, not even close, when the VIX soared 40% or more.
We truly live in unprecedented times, uncharted territory. Ok, that’s interesting, but what do we make of last week’s action.
Emerging Patterns
When examining the blue precedents (or signal dates), we notice the emergence of two post signal S&P 500 price patterns.
The blue lines highlight the 7 precedents. The first chart shows the 8/8/11, 8/24/15, 2/5/18 signal dates. The second chart shows the 2020 and 2021 signal dates.
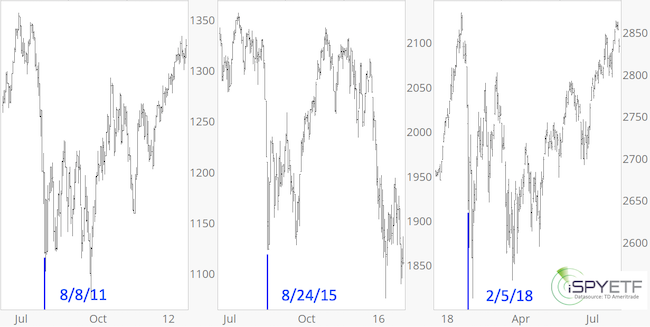
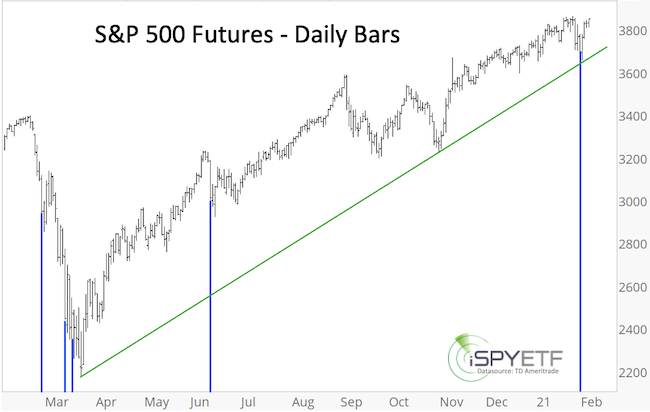
All price patterns fall into one of two categories:
Signal dates occurred near a short-term low (8/8/11, 8/24/15, 2/5/18, 6/11/20), followed by a bounce and eventual break or test of the initial low (double bottom).
-
Price continued to melt lower into the March 2020 low before rallying.
-
The January 27 Profit Radar Report that: “A break below 3,725 - 3,650 is needed for bears to gain the upper hand.” S&P 500 Futures dipped as low as 3,656 on Sunday night. The low tick for the S&P 500 cash was 3,694 on Monday.
Barron's rates iSPYETF as "trader with a good track record" and Investor's Business Daily says: "When Simon says, the market listens." Find out why Barron's and IBD endorse Simon Maierhofer's Profit Radar Report
The bounce from green trend line is not surprising and follows pattern #1 described above. If the S&P 500 follows past precedents, it should not move much above the January high before at least testing last week’s low. If the S&P 500 sustains trade above the January high, the overdone VIX spike may have reset other sentiment extremes enough to allow for further gains.
Continuous updates are available via the Profit Radar Report.
Simon Maierhofer is the founder of iSPYETF and the publisher of the Profit Radar Report. Barron's rated iSPYETF as a "trader with a good track record" (click here for Barron's evaluation of the Profit Radar Report). The Profit Radar Report presents complex market analysis (S&P 500, Dow Jones, gold, silver, euro and bonds) in an easy format. Technical analysis, sentiment indicators, seasonal patterns and common sense are all wrapped up into two or more easy-to-read weekly updates.
|